Energy Operations App
The Energy Operations Application is an oversight hub for monitoring and managing the largest operational expense in a Mining Facility: electrical energy.
The application implements a framework that optimizes the balance between operational uptime requirements and strategic load curtailment opportunities. By dynamically evaluating real-time market pricing against pre-purchased energy contracts, the system automatically executes curtailment decisions to maximize financial returns and operational efficiency.
Typically, energy flow is provided by an Independent System Operator (ISO), like MISO, PJM, SPP, ERCOT, etc. These will provide
- Power Purchase Agreements (PPA) - Settlements to provide energy at a fixed rate for a given period
- Day-Ahead Load Market Purchase - Settlement to provide energy at a given rate for the next day
- Real-Time Load Market Purchase - Transactions on the highly volatile live market, with prices exposed to public supply and demand
These are compared against application parameters such as profit, loss, uptime, and temperature thresholds to decide when to automatically curtail.
EOS Table
EOS table is the main oversight tool for status and operations. Selecting a connected site displays a per-hour breakdown of:
- Hour ending: the ending time of the 1-hour range this measurement applies to.
- Flow in MW: The actual measured energy flow through the selected site.
- DA bid load and Price: This is a projection parameter, not a measurement. It can be edited through the buttons on top of the table.
- PPA position, Price and Cost: When a PPA is active.
- DA position, Price and Cost: The actual energy purchased the day before at the applicable localized Day-Ahead price (Location Marginal Price, i.e. the price down to the actual ISO node scope, which might differ from other nodes/zones).
- RT position, Price and Cost: The difference between contracted energy (PPA/DA) and actual consumption. Any surplus energy is returned to the grid, while deficits are supplemented from the grid—both at current real-time market rates.
- Electricity Cost and Effective Rate: The total actual costs, aggregating both pre-purchased and real-time acquired energy expenditures, with calculated effective rates per unit of consumption.
- Uptime: The uptime during this hour.
- Actions: Users can manually input downtime minutes (scoped by affected structure) by clicking the icon, edit the Hourly DA Bid by clicking the icon, or flag a given interval as
low uptime, which will curtail only miners that have low uptime requirements in case a curtail signal is issued during that period. The entered downtime will be excluded from customer billing.
At the top, you'll see the live Current Energy Consumption measurement, along with the Load Factor. Load Factor is a measure of the consistency of electrical consumption. It is a ratio that compares the total actual energy consumption over time to the maximum energy consumption (peak demand) during that same time period. A Load Factor approaching 100% demonstrates very little variance of consumption from the peak demand, while lower values indicate significant variation in energy consumption from the peak demand. Patterns of energy consumption peaks and valleys could be indicative of opportunities for operational adjustments and cost optimization.
Sitemap
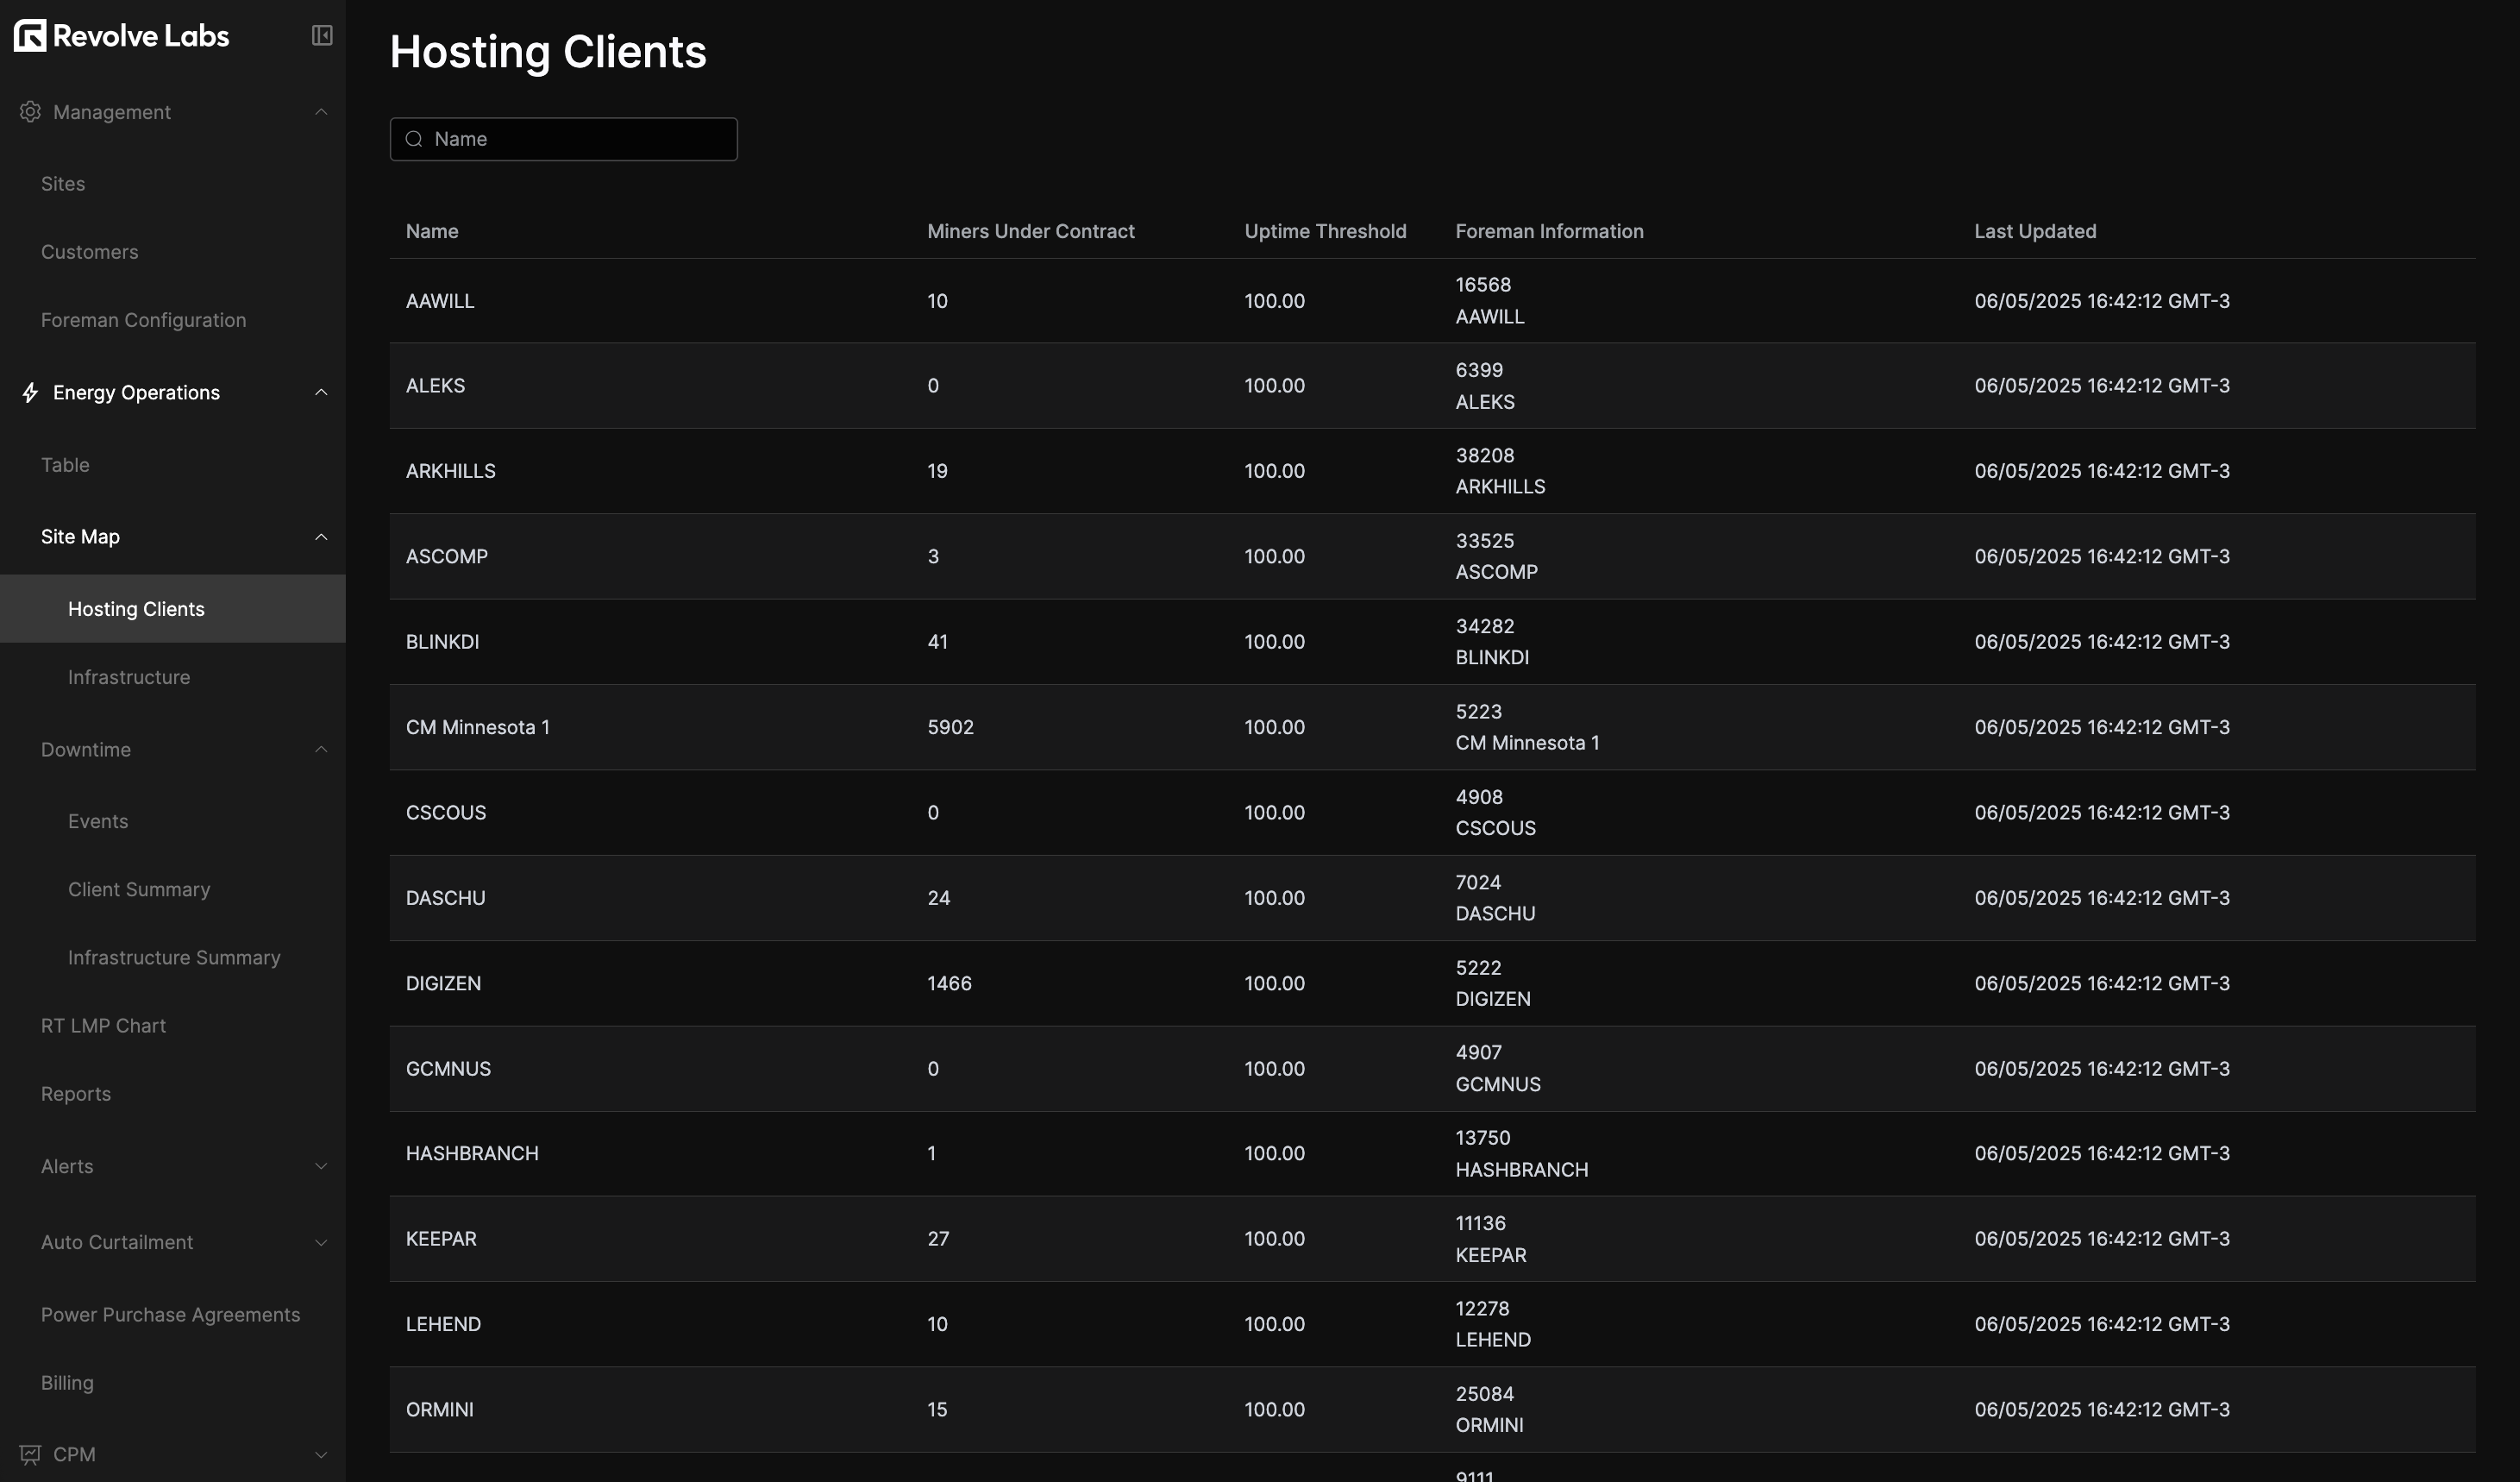
The sitemap provides a quick overview of the hosting clients' hardware-related contract and downtime information.
In the Hosting Clients section you'll get the miners amount and uptime threshold set by contract for that customer.
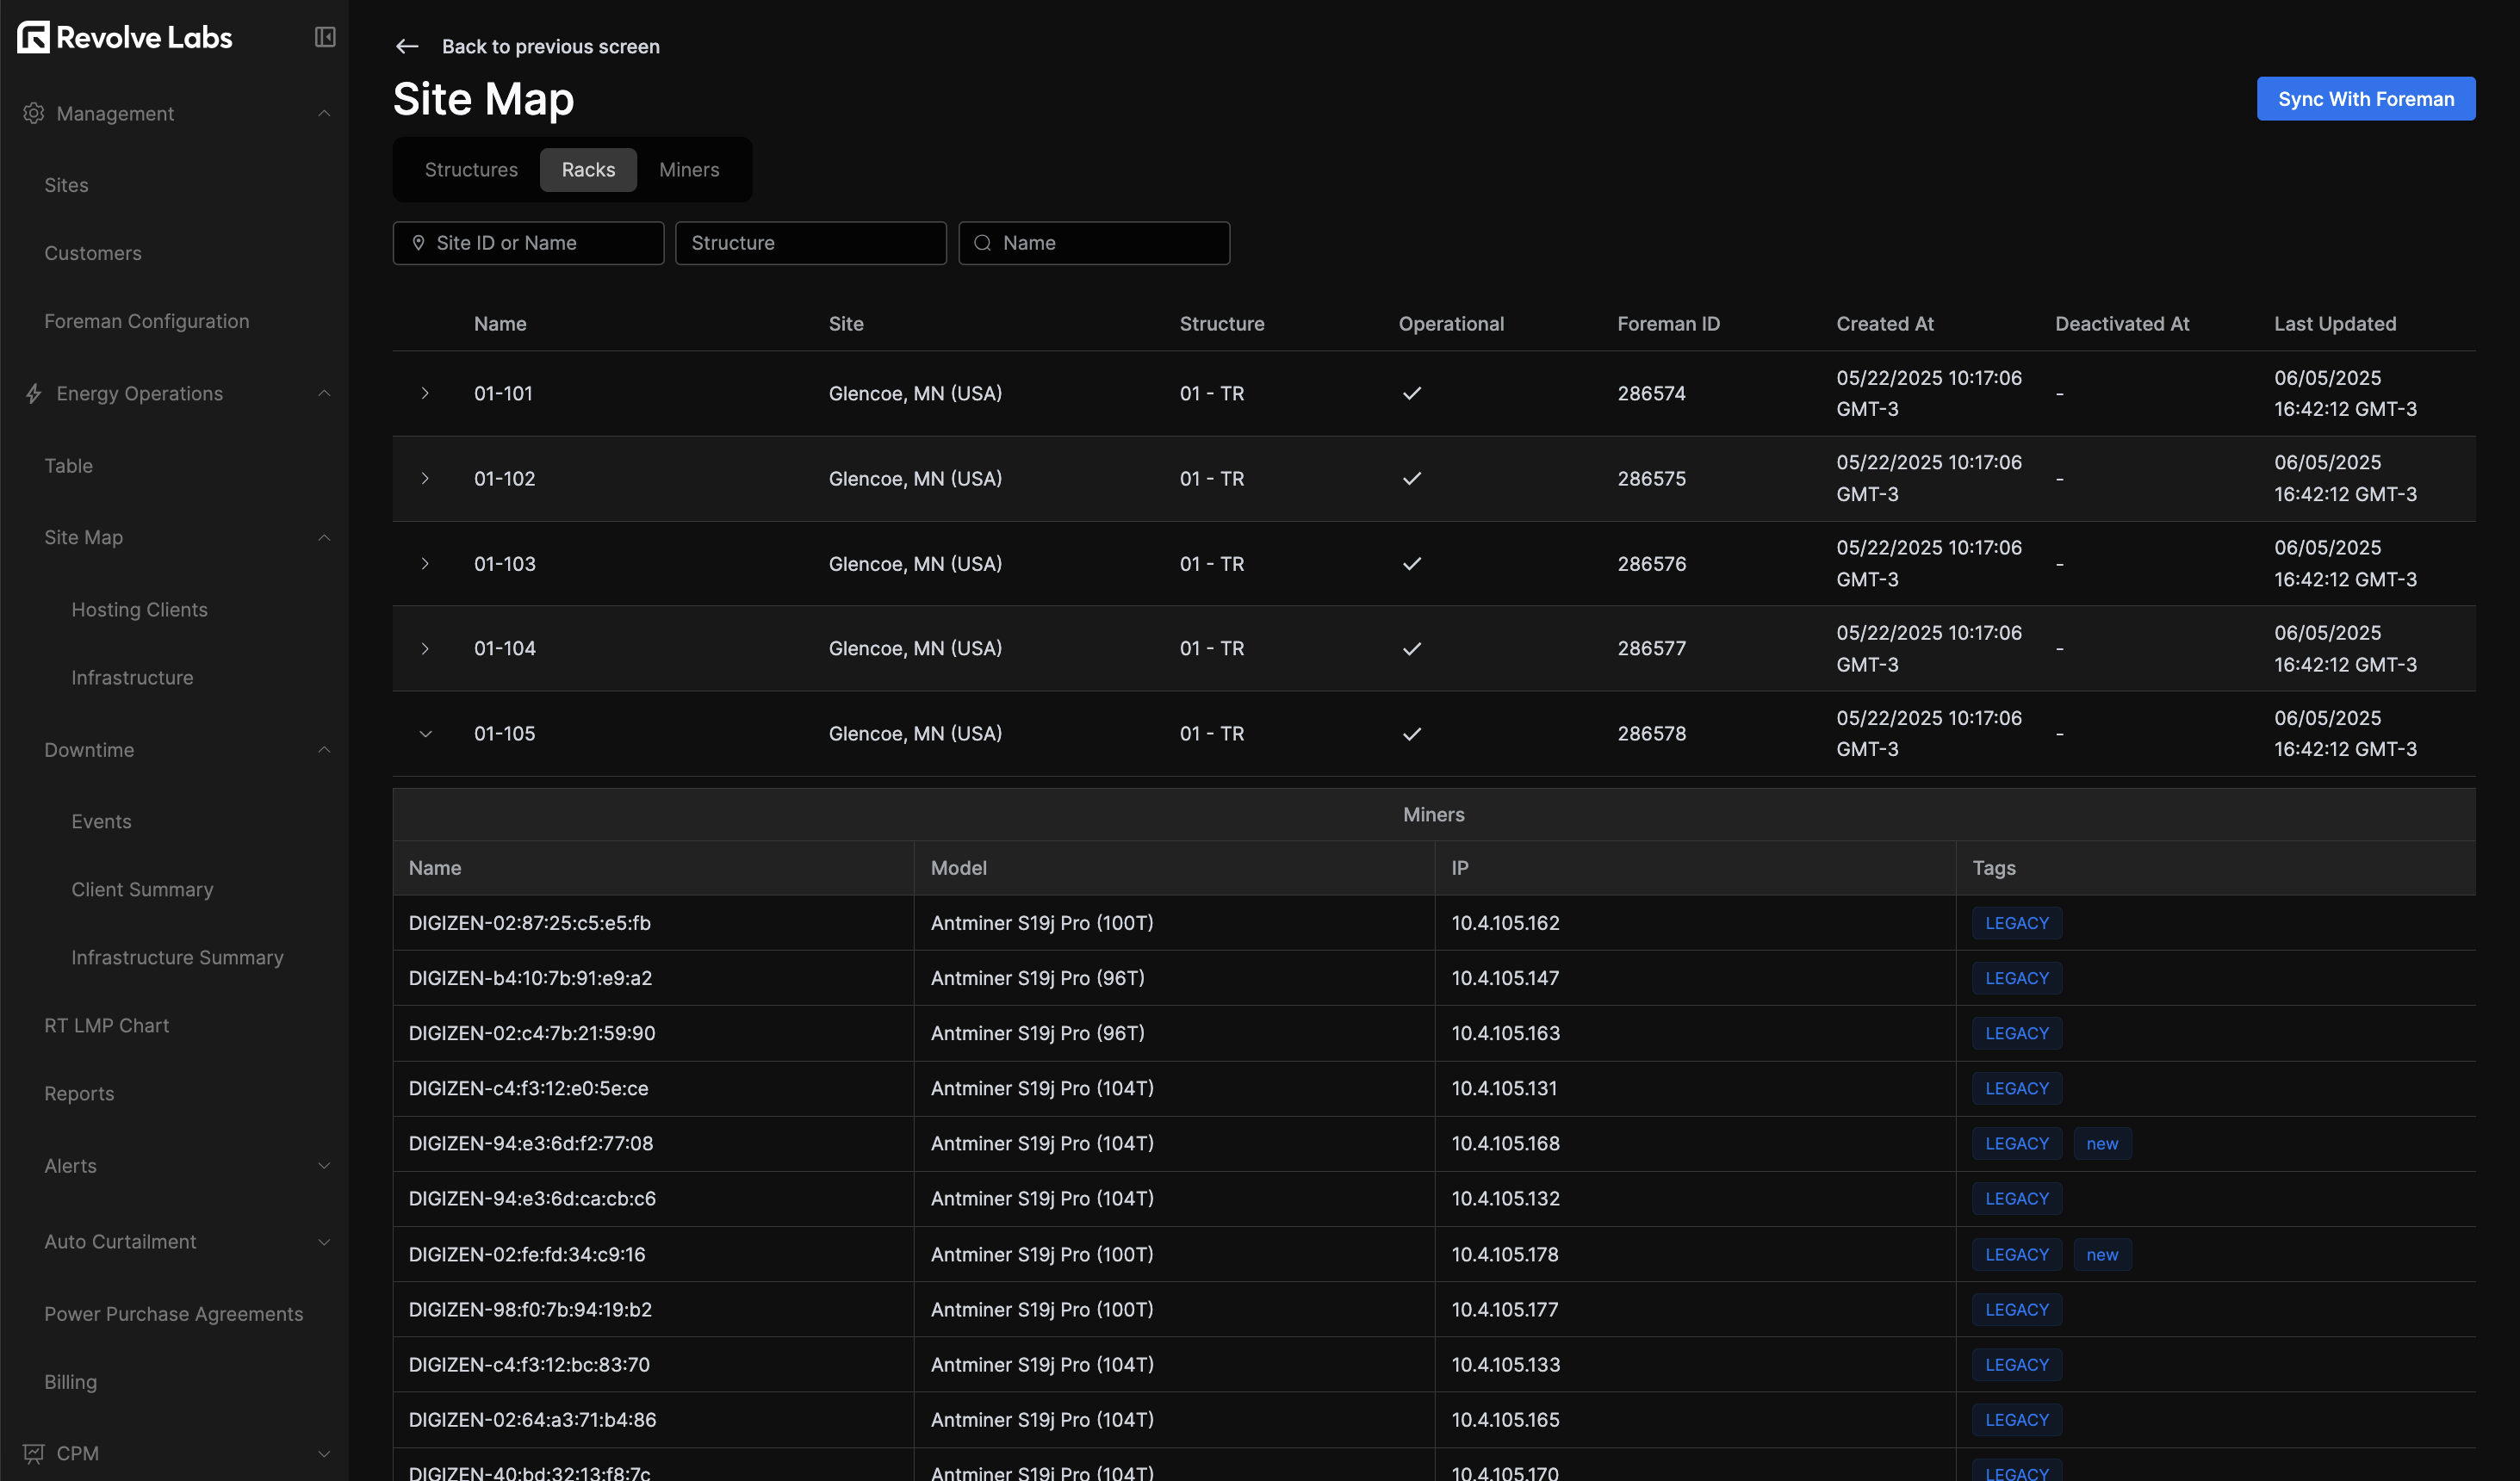
In the infrastructure section, you'll find a hardware status and downtime breakdown -by sites, racks or miners- reporting fine-grained data from the Foreman API.
Downtime
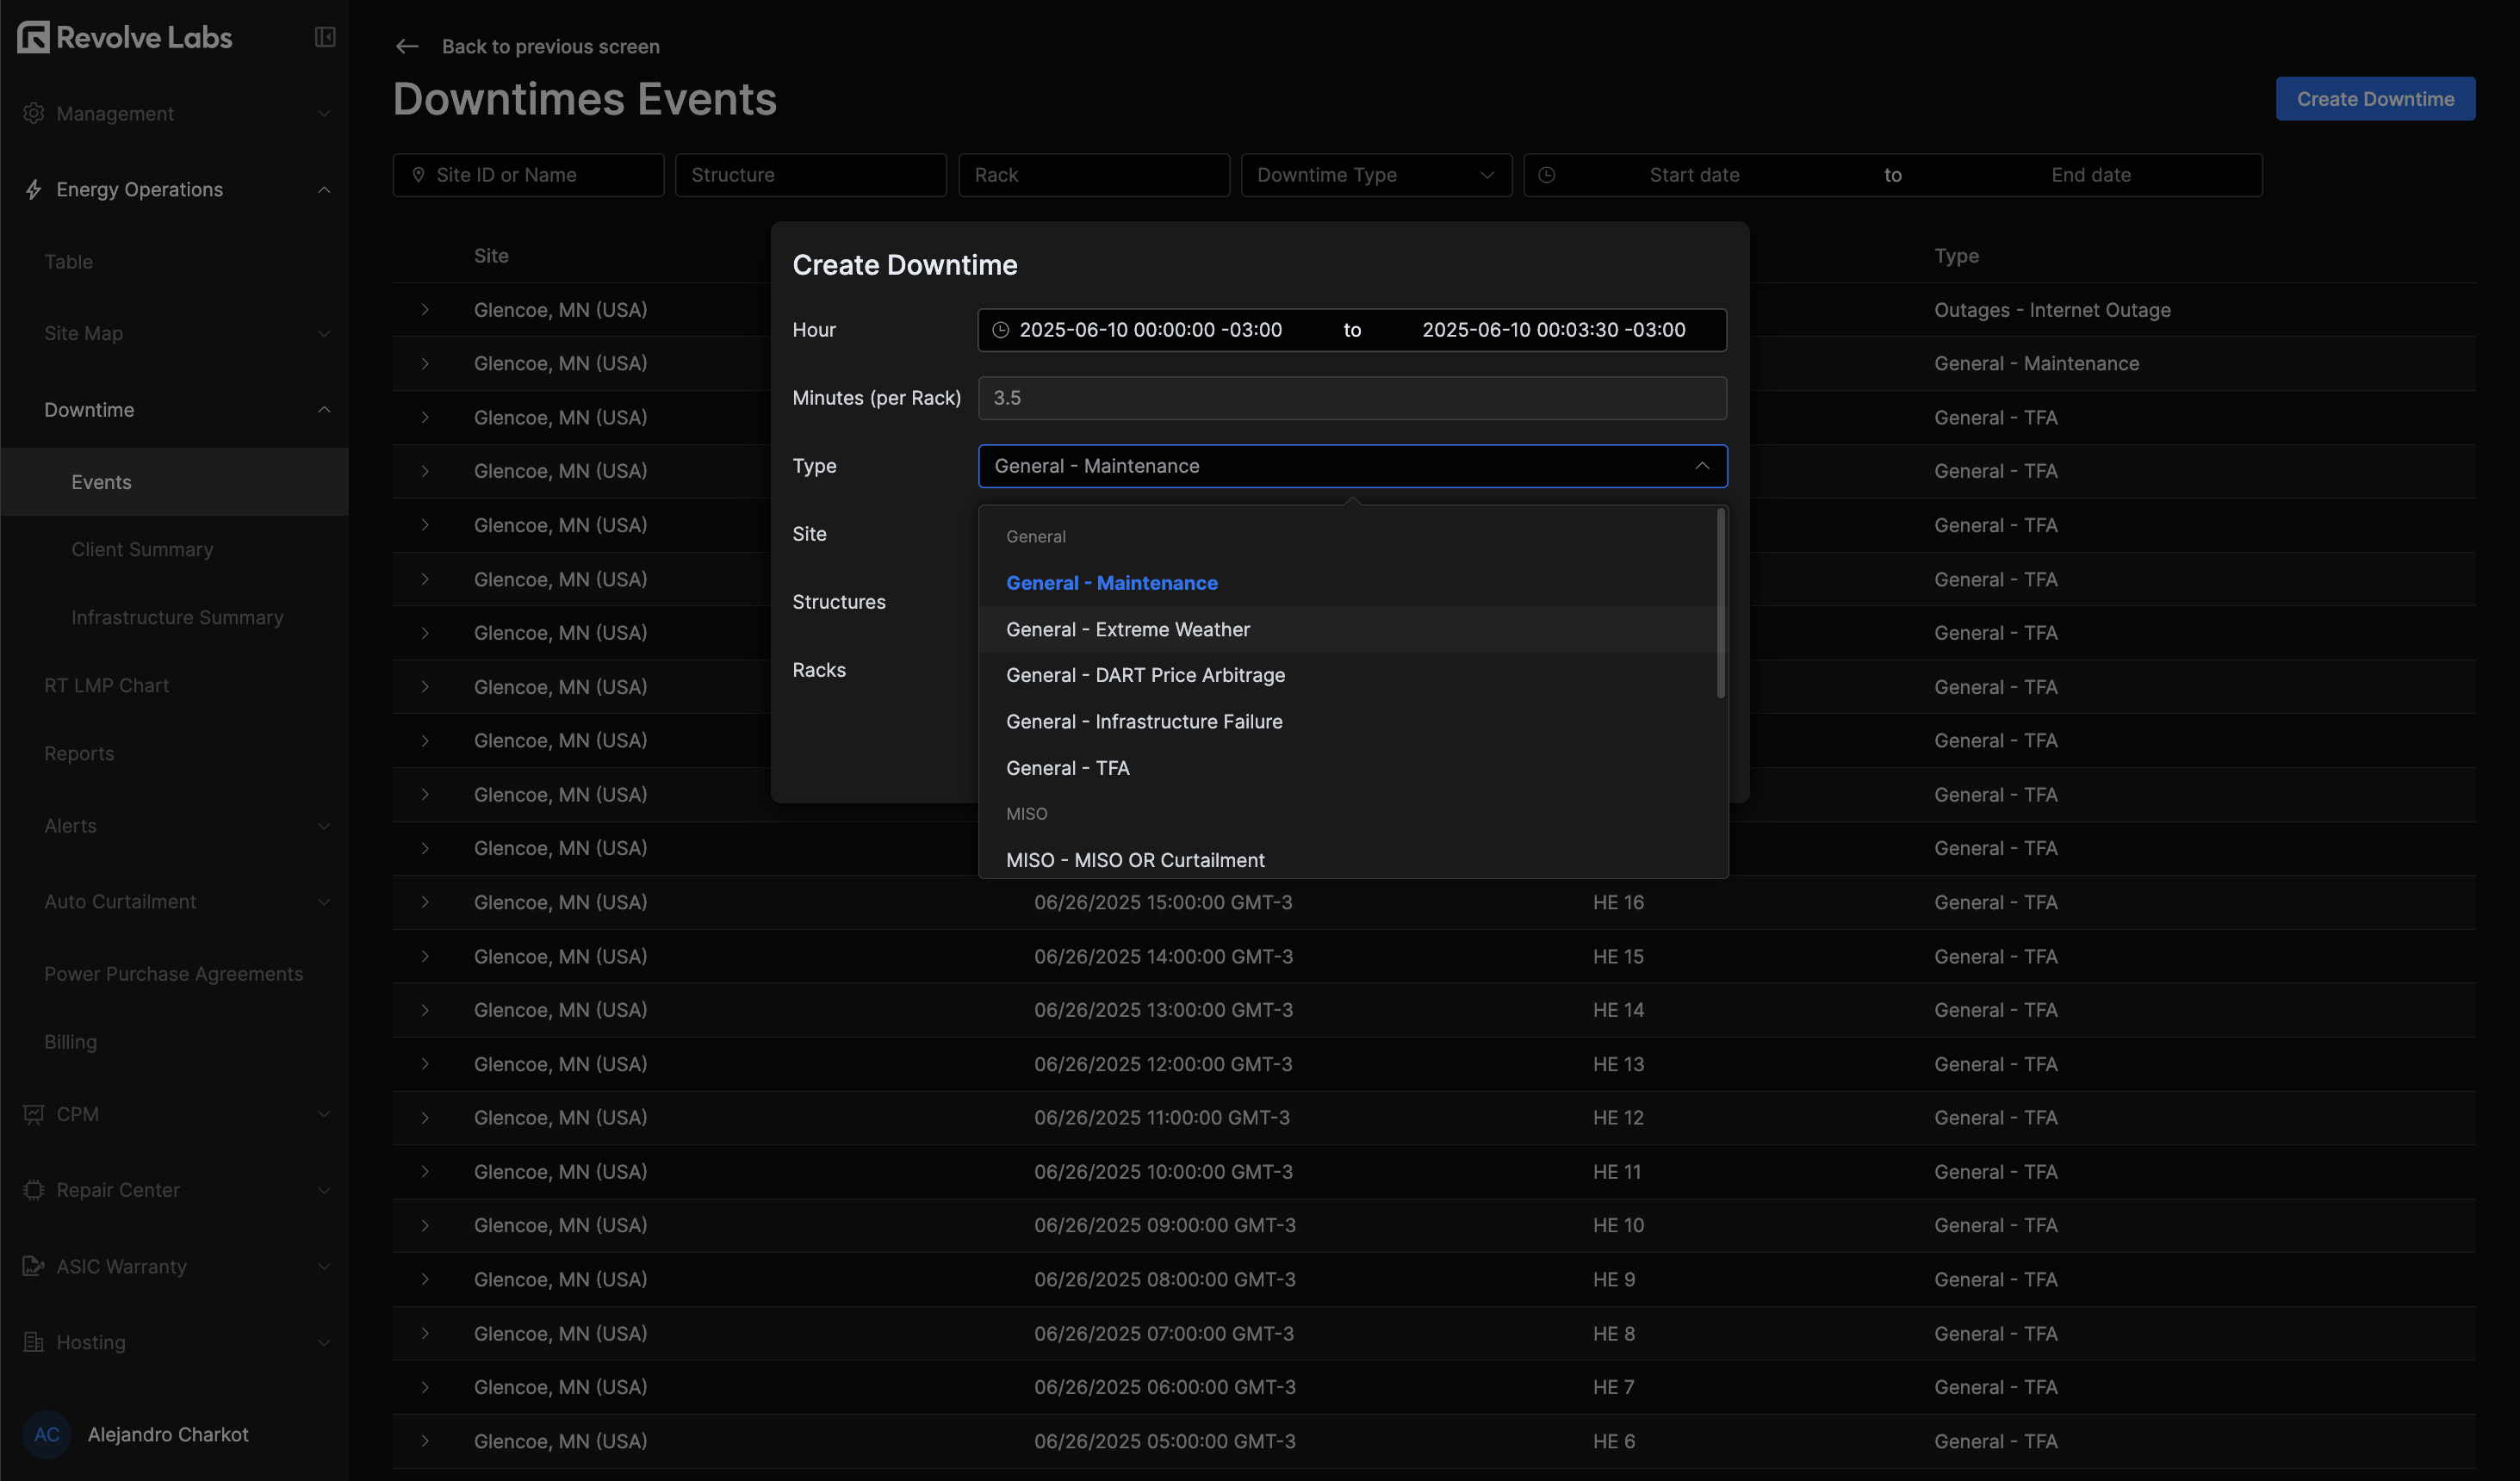
Next is the downtime section, which provides a detailed view of downtime events across all sites, including the reason for downtime, the affected structure, and the duration of the downtime.
In the Events subsection managers can create and manage downtime events, which will be reflected in the EOS table and the Hosting Clients section, specifying time, reason, affected scope (whole site, structures, or racks), and duration. This level of detail enables thorough reporting.
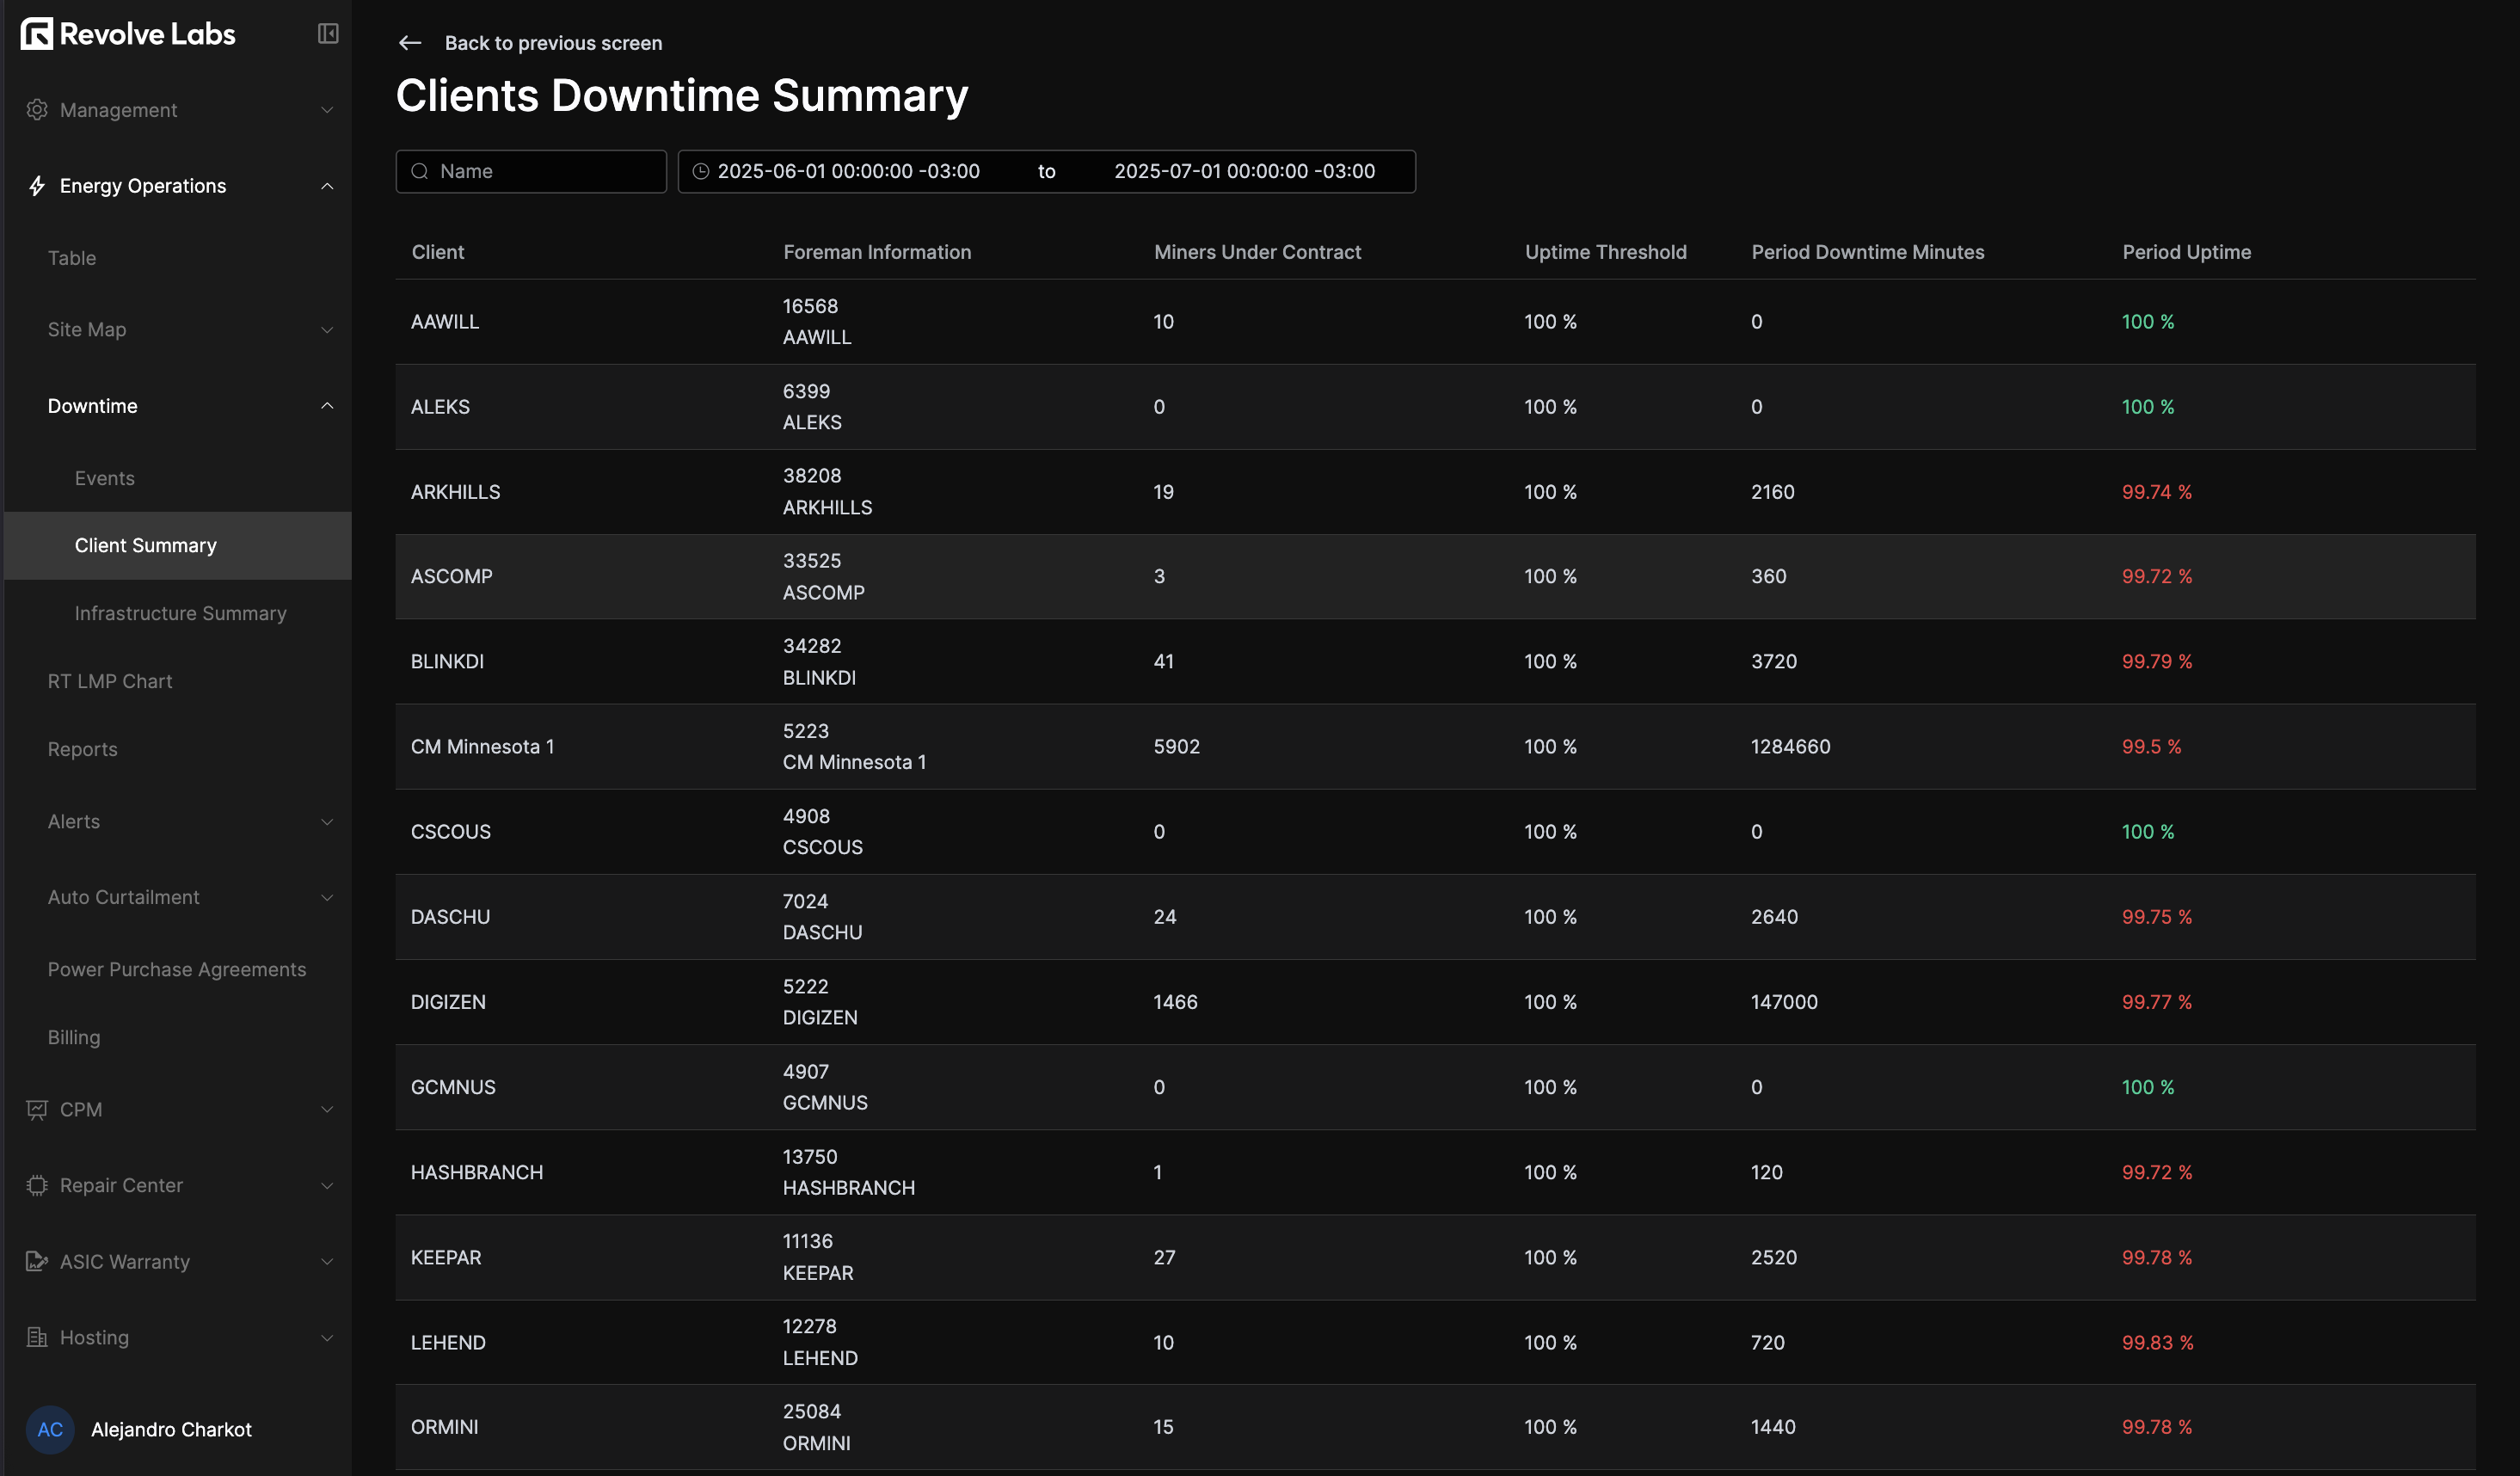
Following you'll see the Client Summary section, displaying a table with the total miners count, downtime minutes and uptime percentage per client.
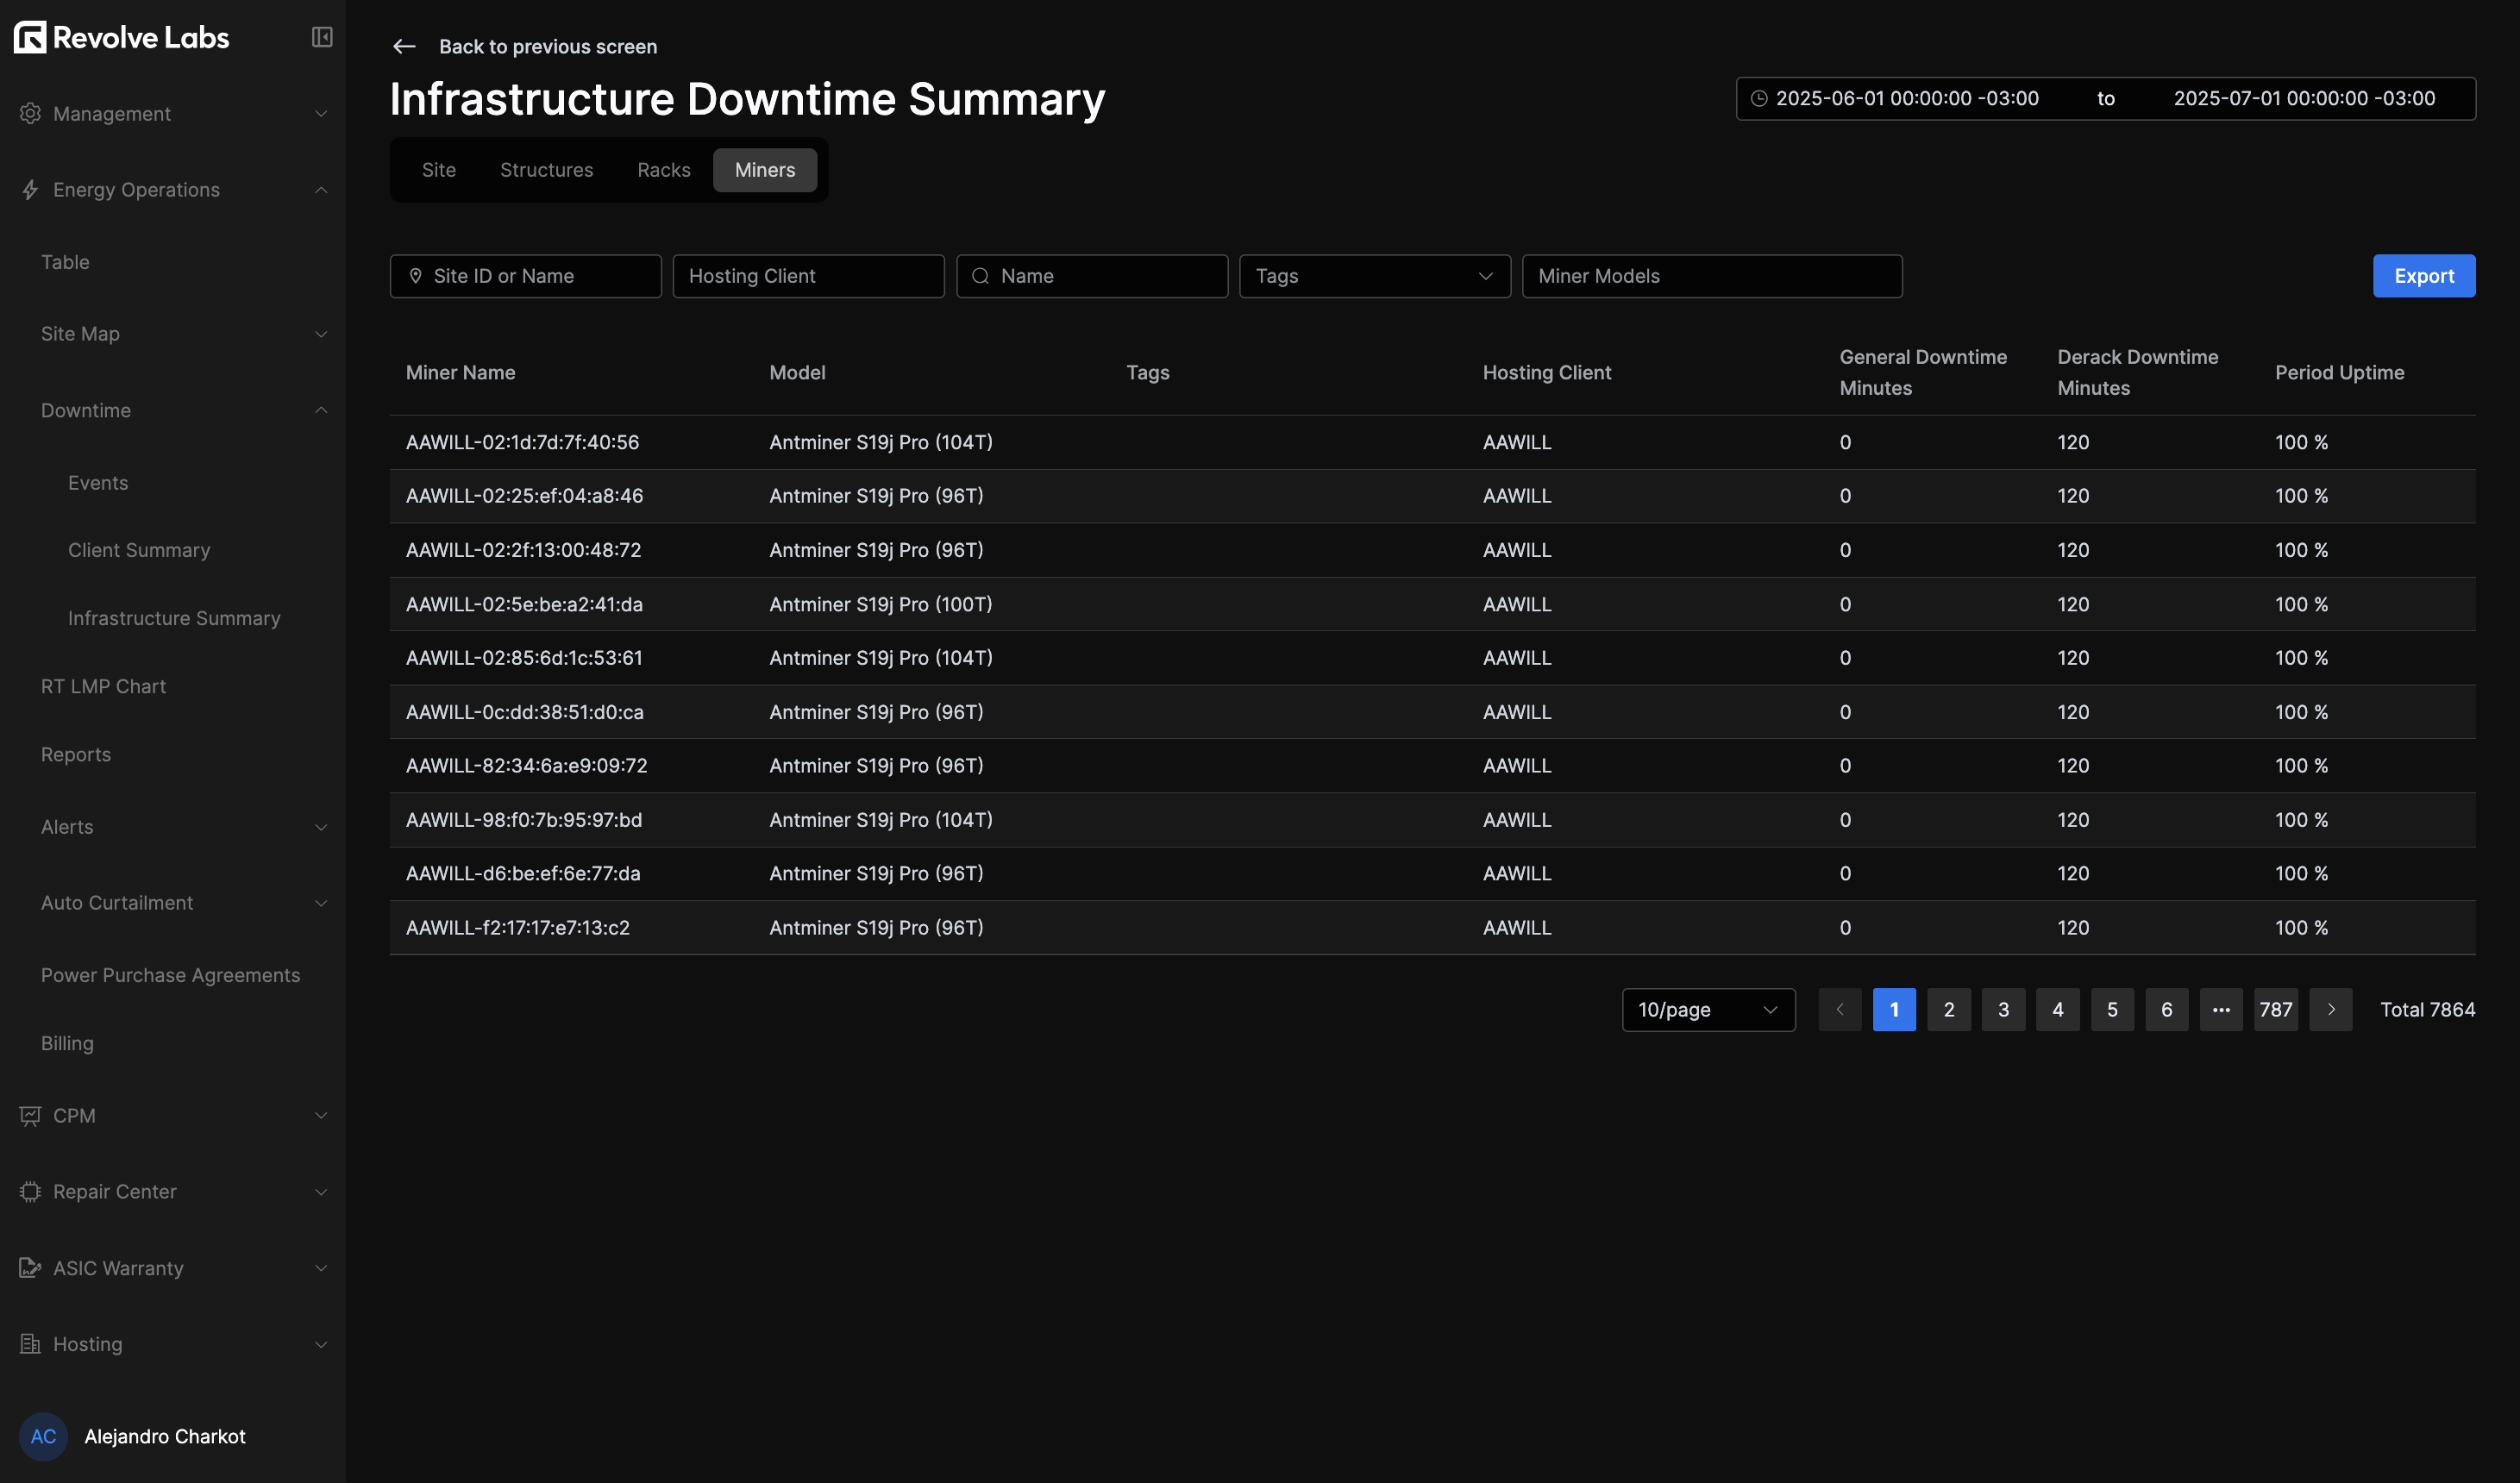
Finally there's the Infrastructure Summary section, which provides a breakdowns of downtime by site, structure, rack and miner. This allows for quick identification of recurring issues and areas for improvement.
RT LMP Chart
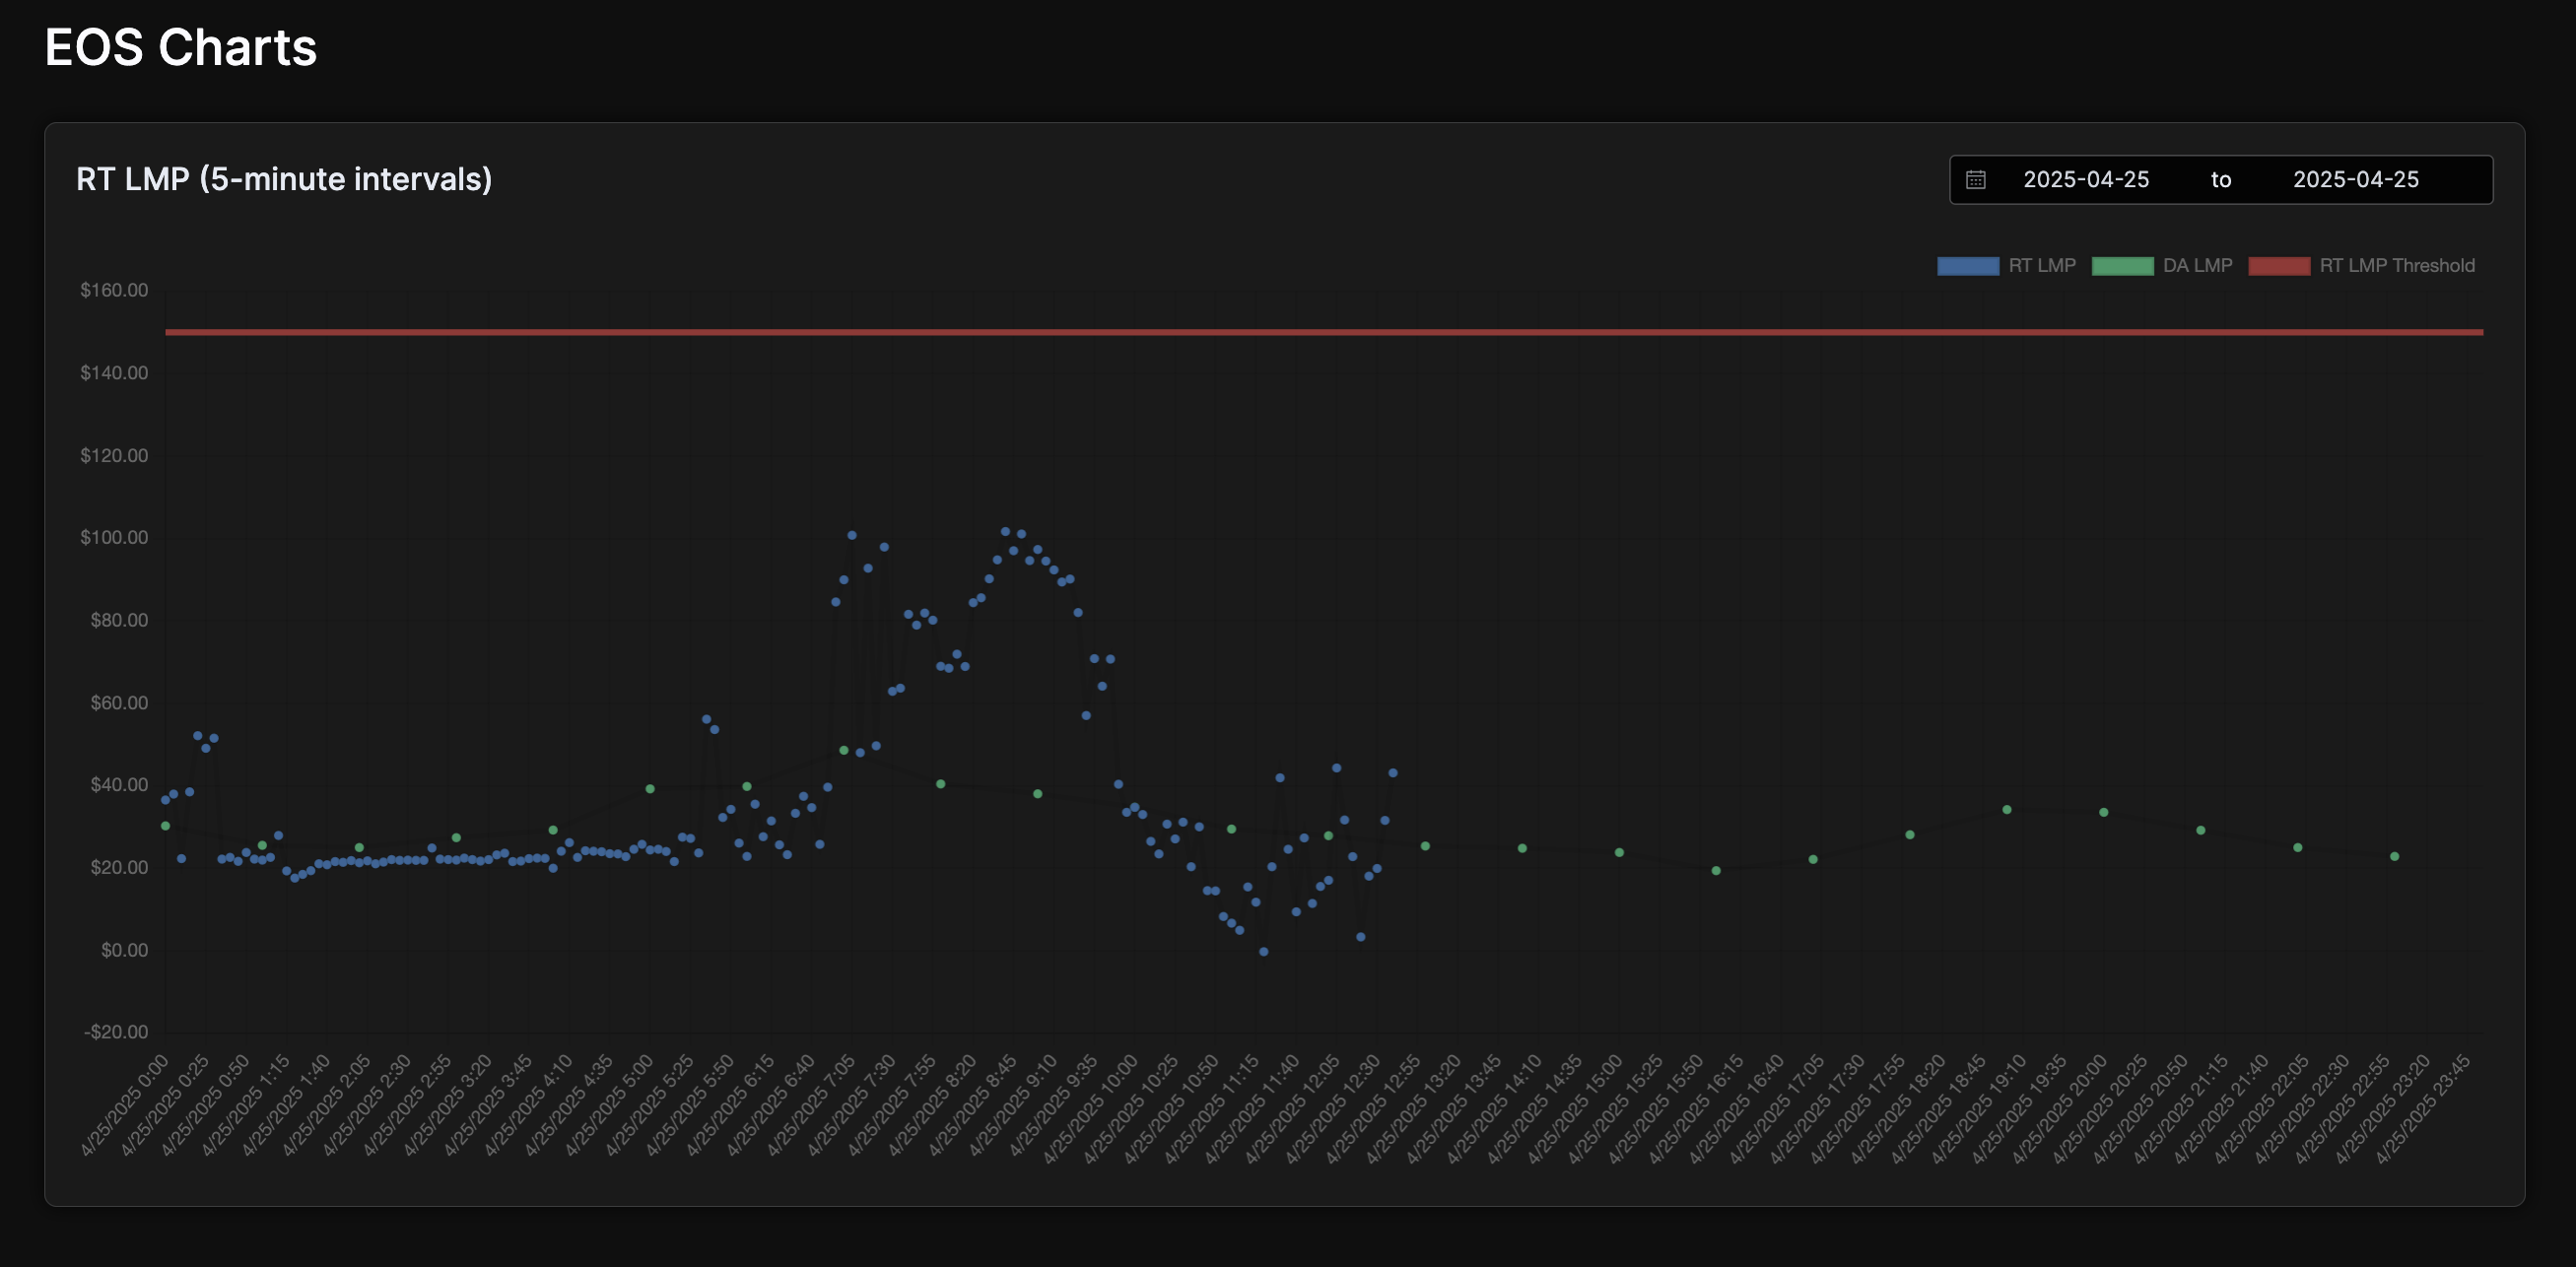
The RT LMP Chart displays the localized RT vs DA market prices (down to 5-minute intervals) along with the current RT Alert Threshold set in parameters. If the RT price goes above this value, you'll get a notification on the configured Slack channel.
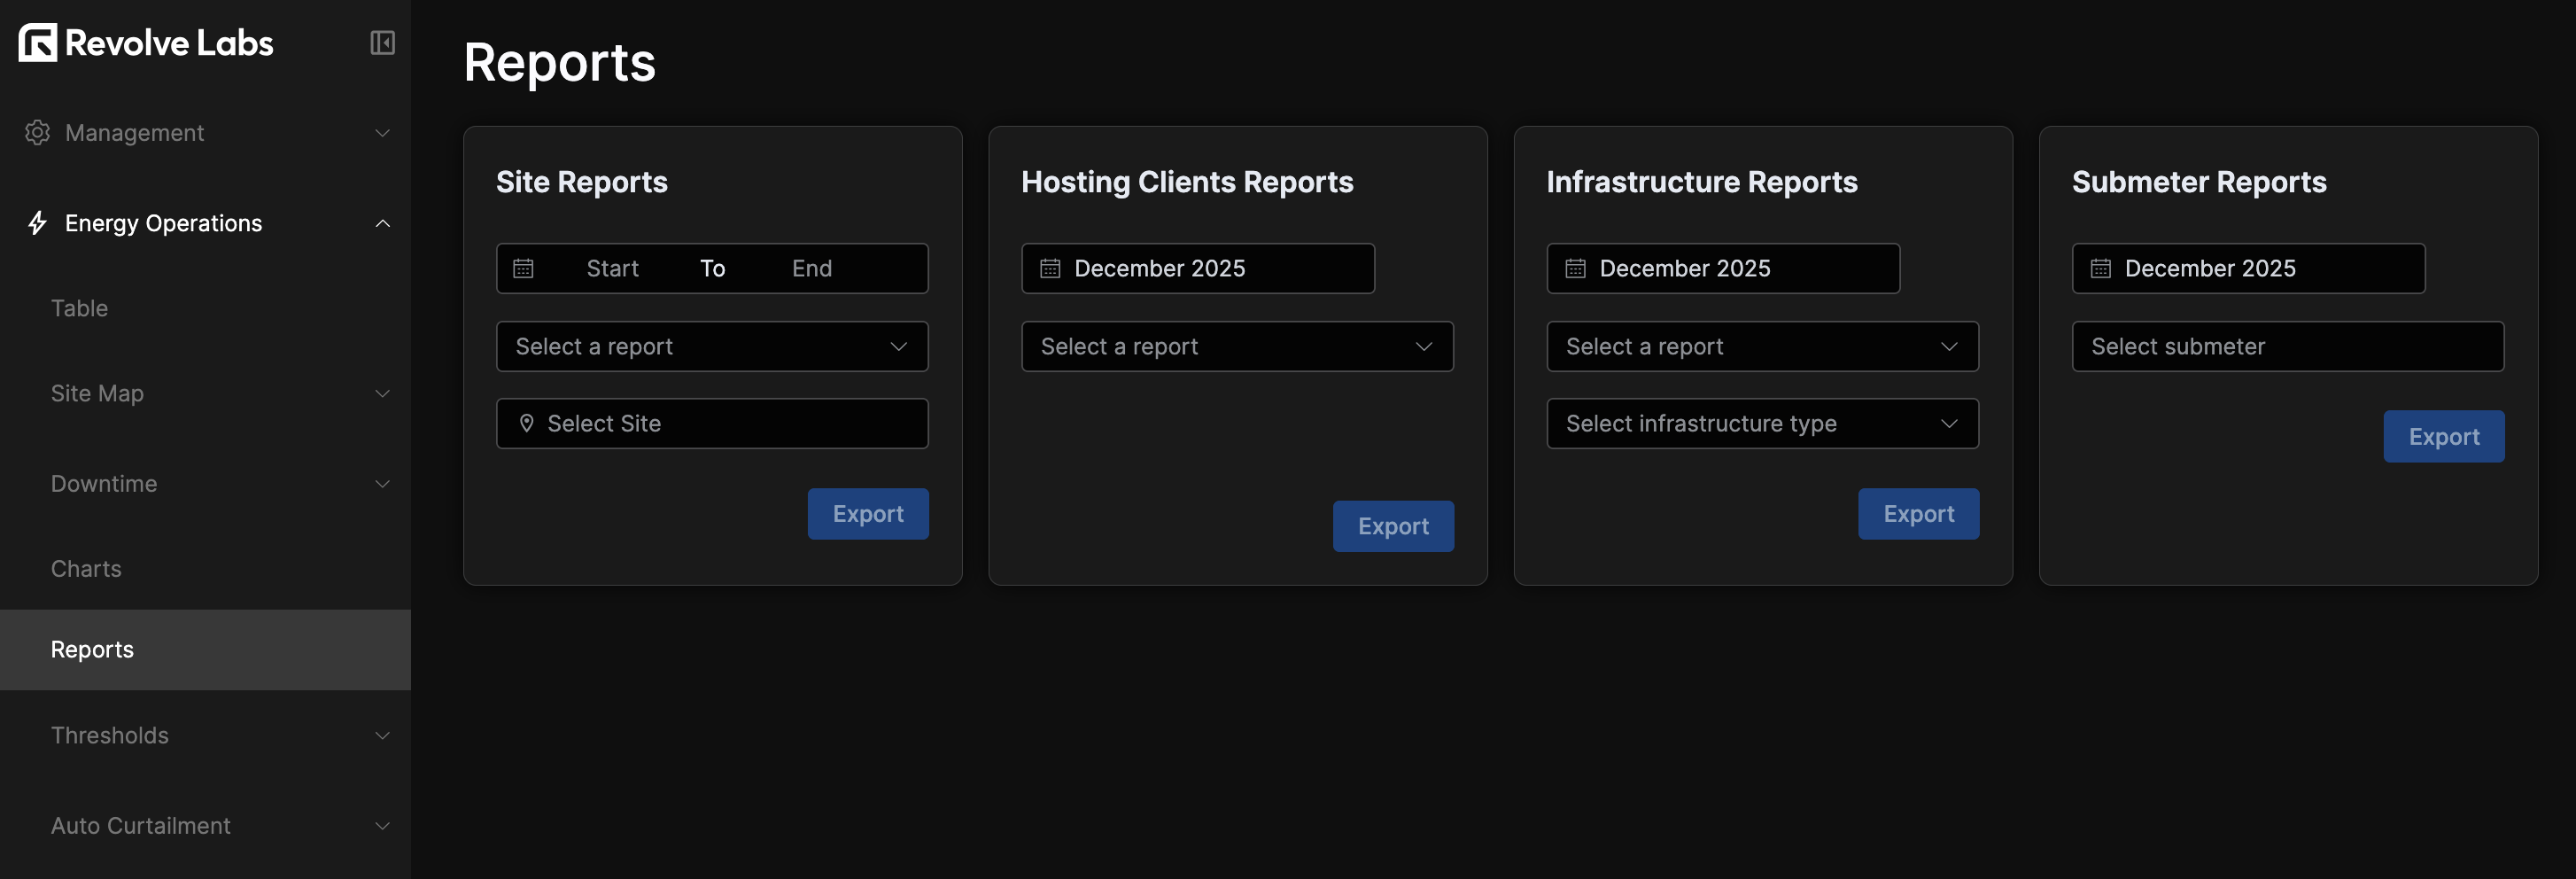
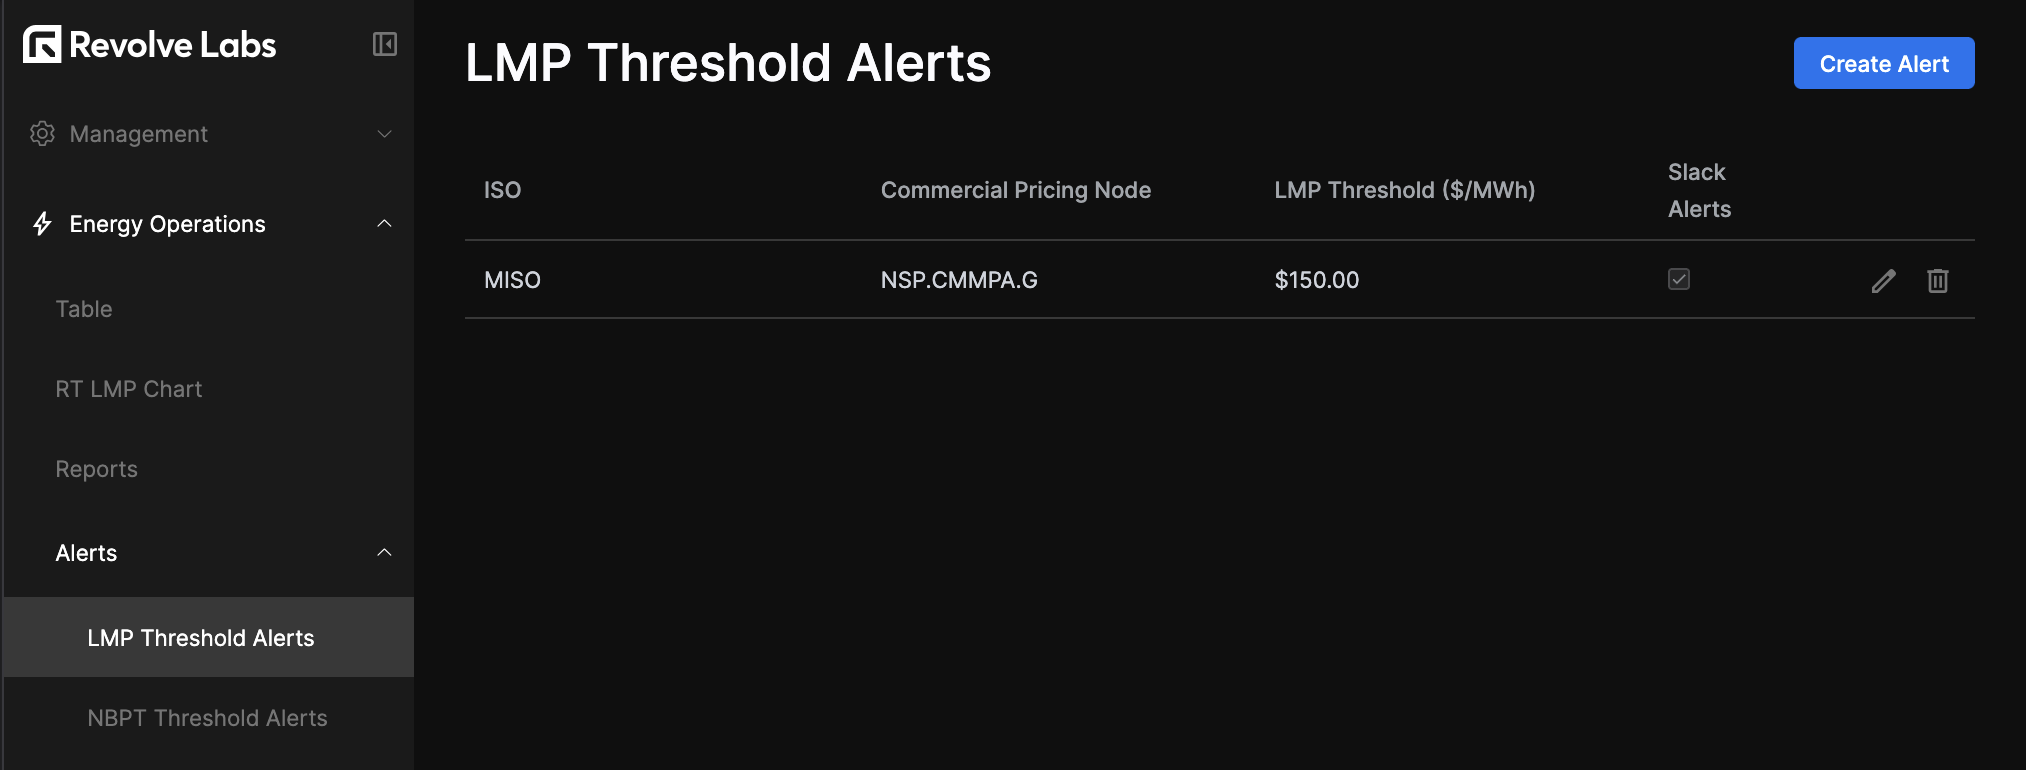
Reports and Alerts
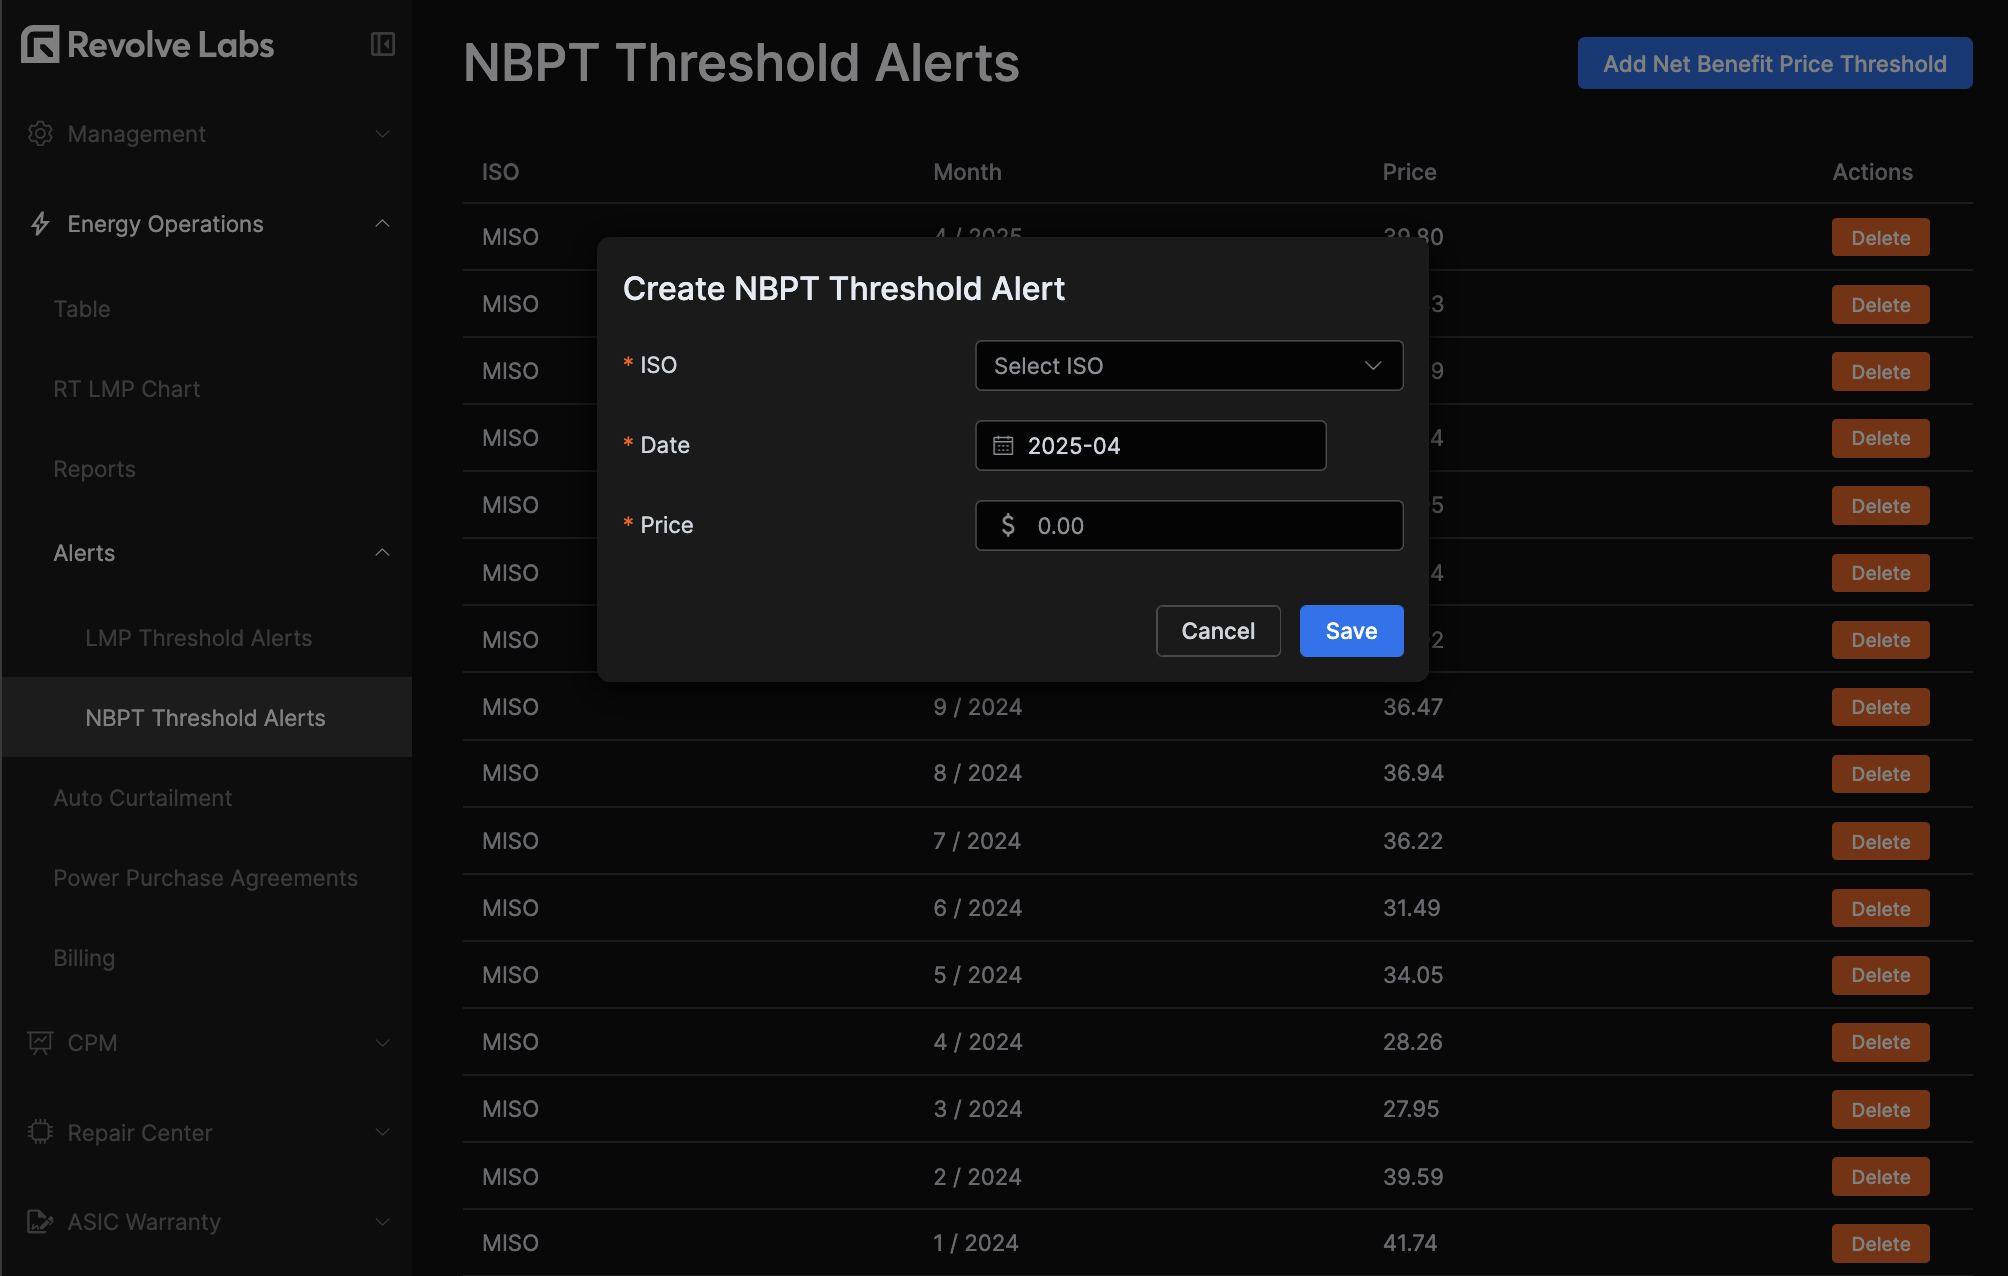
These sections allow you to export the main table data to CSV for any available data range, and set price-threshold-based alerts, either by LMP or Net Benefit Price (NBPT).
Auto Curtailment
In the auto-curtailment tab, you'll see the configuration settings controlling the sites' curtailment behavior, and some default values to fallback to.
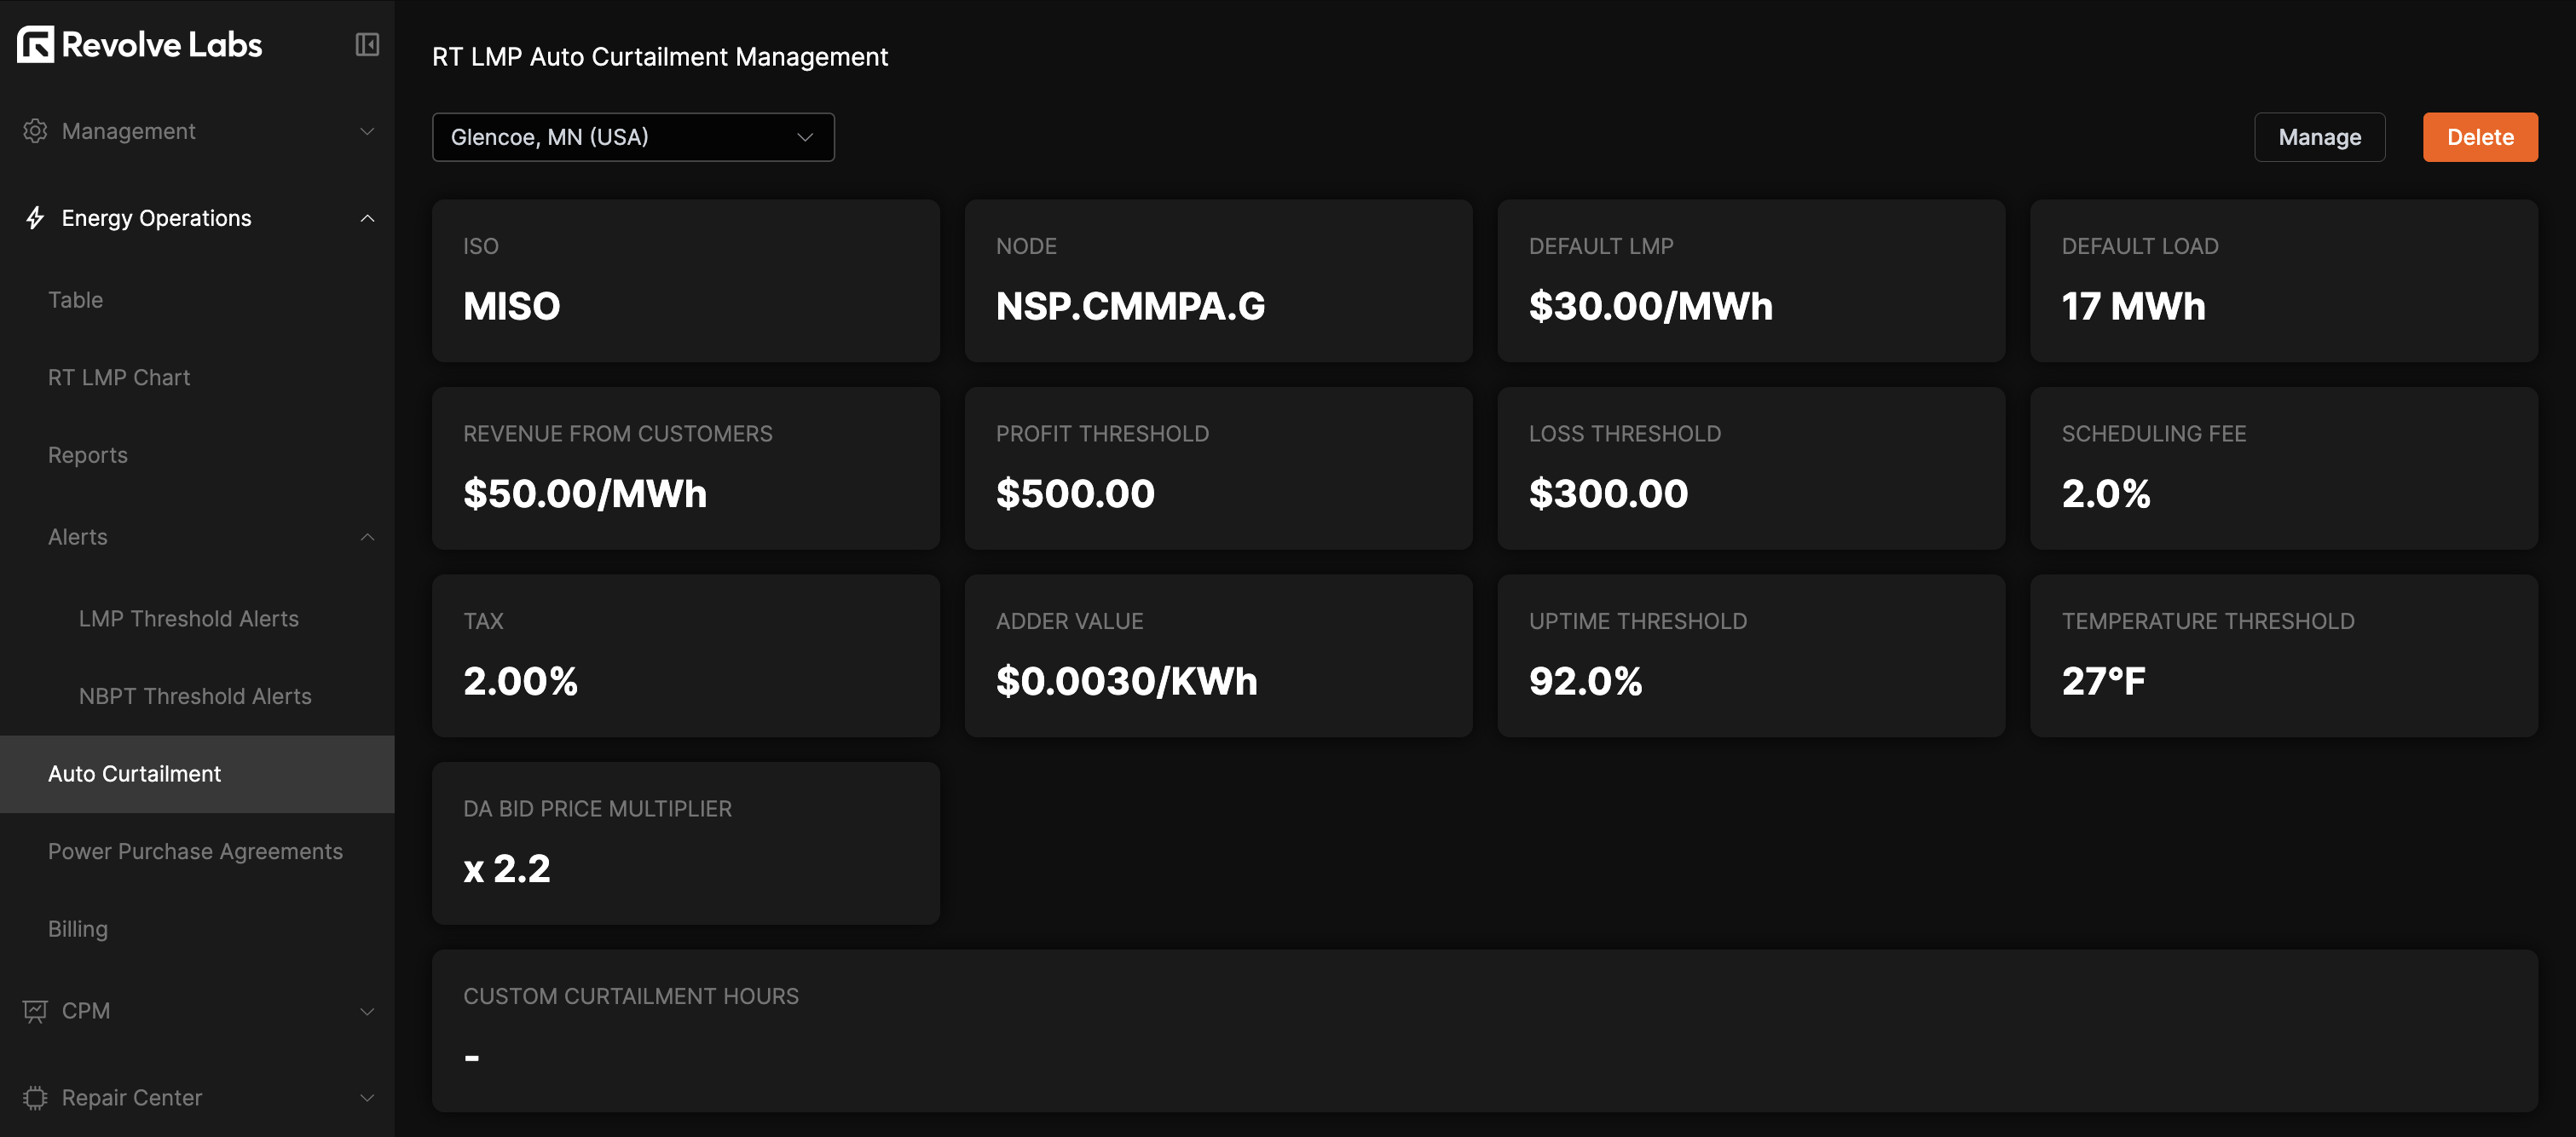
- The Profit Threshold indicates the minimum profit expected for the remainder of the given hour to curtail.
- The Loss Threshold represents the maximum loss allowed for the remainder of a given hour before curtailing.
- The Uptime and Temperature thresholds establish the minimum values at which curtailment can occur. The system will not initiate curtailment when measurements fall below these thresholds.
- Default LMP sets the price we use as a default when assuming the pricing for the remainder of the hour (unknown data points).
- Default Load is the threshold number of MWh used to determine the DA or RT settlement. If the
DA Pos.is lower than the default load, we assume we are exposed toRTpricing. - Customer revenue is the revenue we expect per MWh using the current pricing. If market conditions and agreements change, this number needs to be modified.
- Scheduling fee, adder value, and tax rate—additional taxes and fees that are paid on top of raw energy price.
To update any of these, click the "Manage" button, edit as desired and save.
Power Purchase Agreement
You can add and manage Power Purchase Agreements (PPAs) in the system, integrating them into the Energy Operations System calculations and optimization logic.
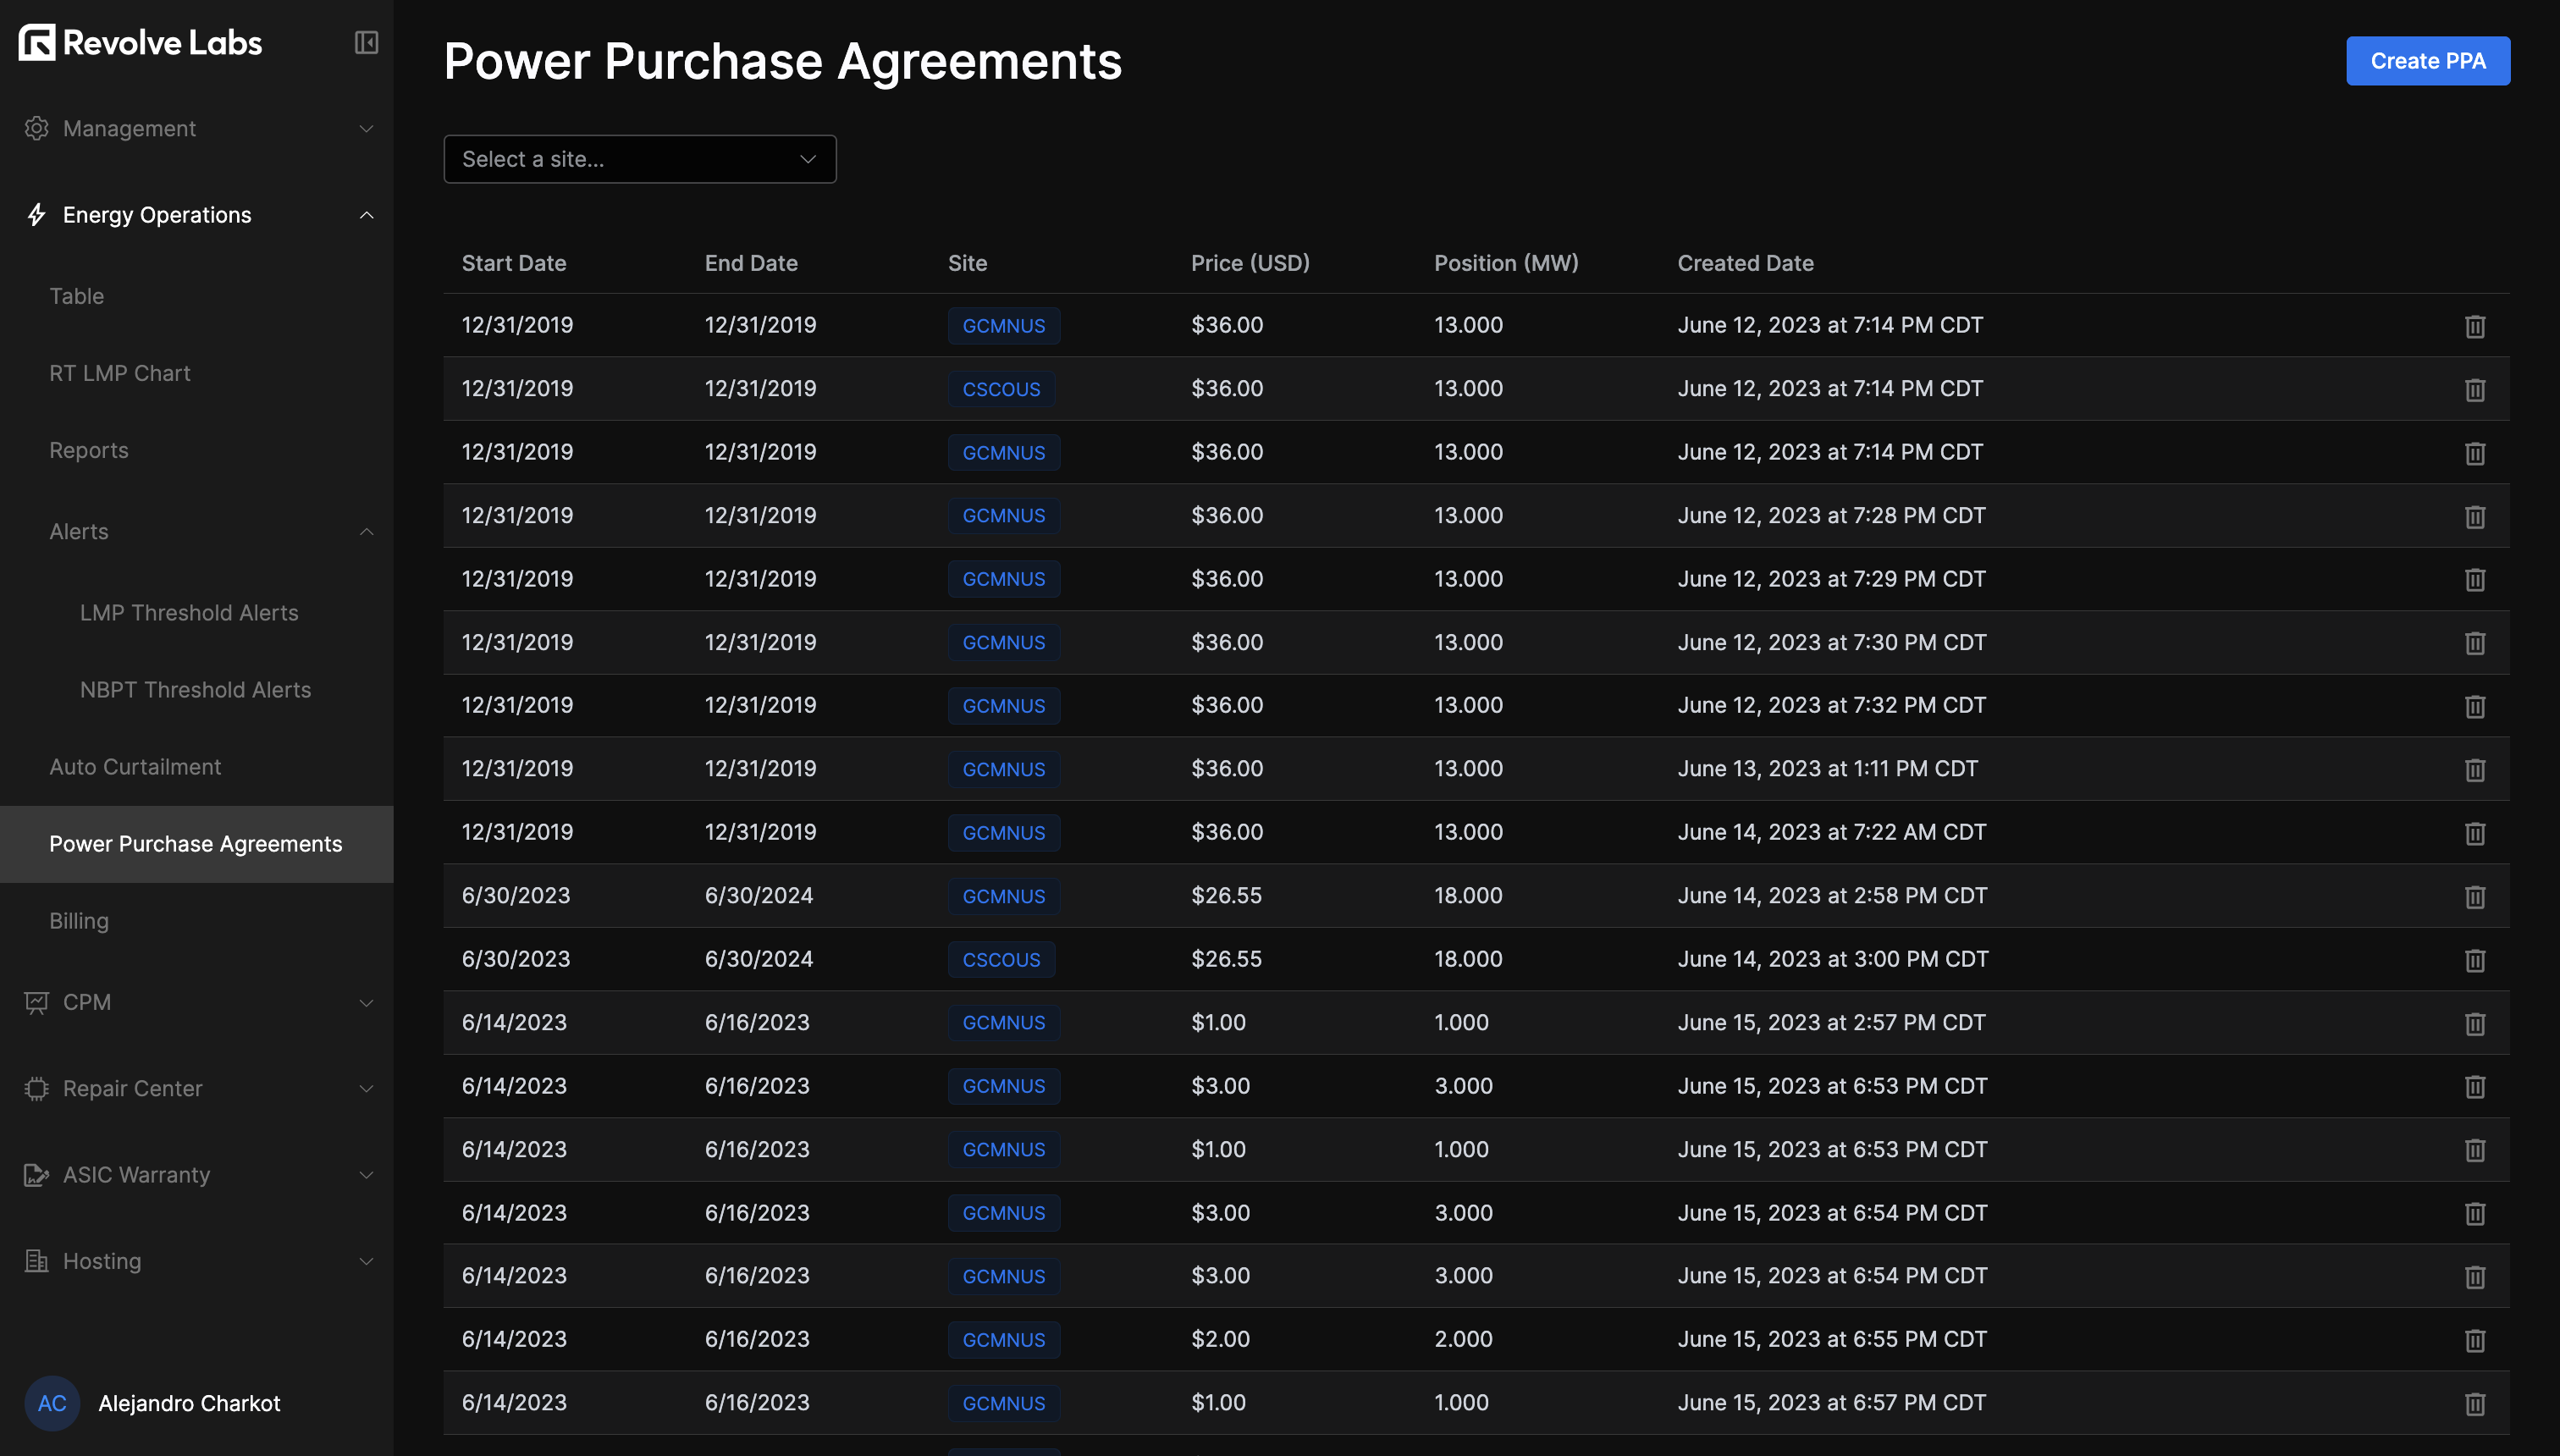
To add a PPA, click Create PPA and complete the form.
Billing
In the Billing tab, you'll see a breakdown of projected costs (based on the available loads and market price data) against actual ISO-billed costs, entered manually.
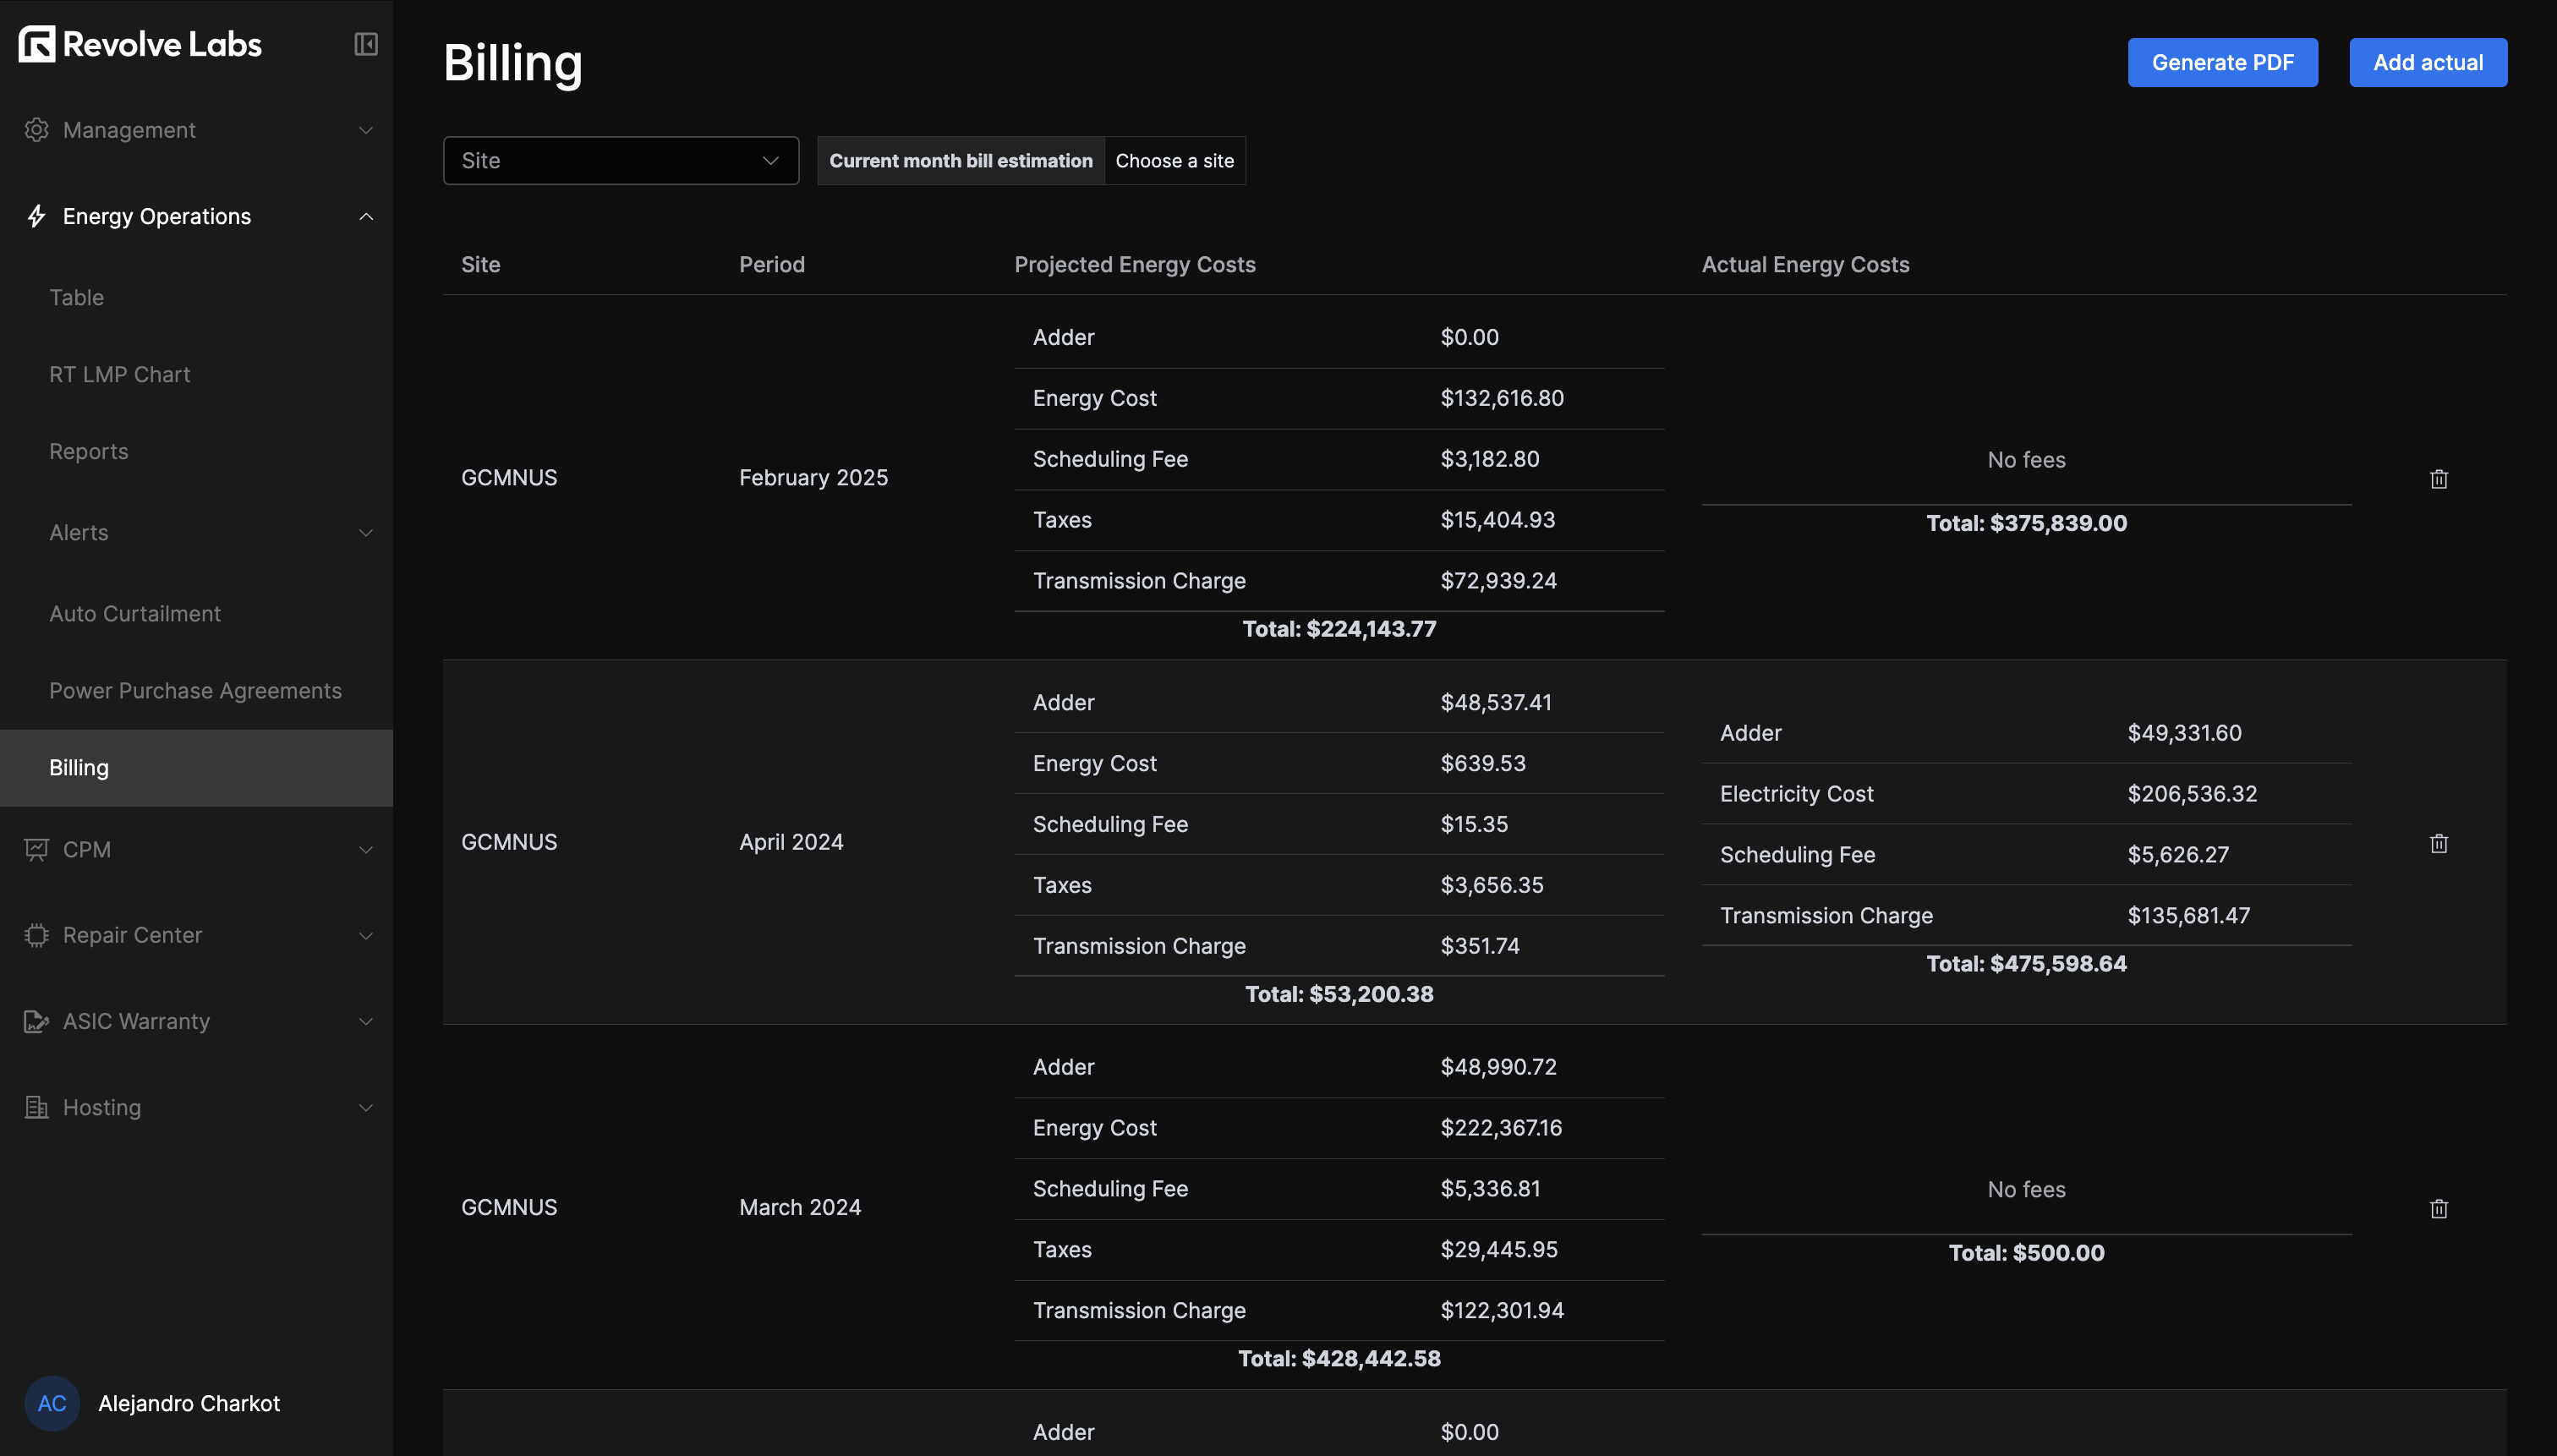
To enter a bill, click the "Add actual" button and fill in the form.
You can export as PDF by site and period if needed.