Demand Response
Beyond purchasing energy, a Mining Facility can be paid to reduce its consumption on demand. Independent System Operators (ISOs) run Demand Response programs that compensate large loads for curtailing when the grid is stressed. Because mining load is highly flexible, participating in these programs turns curtailment from a purely defensive cost-avoidance measure into a revenue stream.
On MISO, the Demand Response section covers two program families:
- Day-Ahead Price Response (DAPR) — the site commits a day in advance to curtail when day-ahead prices clear above a strike level, and is paid for the energy it sheds against its expected consumption.
- Operating Reserves (OR) — the site stands ready to curtail on short notice and is paid for that availability at the Marginal Clearing Price (MCP), whether or not it is ultimately called.
Participation revolves around a few shared concepts:
- A dispatch is an instruction from the ISO to curtail for a given window. Dispatches and their underlying curtailment plans are visible under Downtime → Site Dispatches.
- A baseline is the consumption the site would have had absent curtailment. Earnings are measured as the gap between the baseline and actual metered load, so an accurate baseline is essential.
- Baseline reset days are the days the ISO uses to recompute that baseline. Because dispatched days are excluded from the calculation, the facility must accumulate enough non-dispatched days to keep the baseline representative.
The tools in this section let you enroll sites into programs, track per-program earnings, monitor performance against expectations, and reason about baselines.
Program Participation
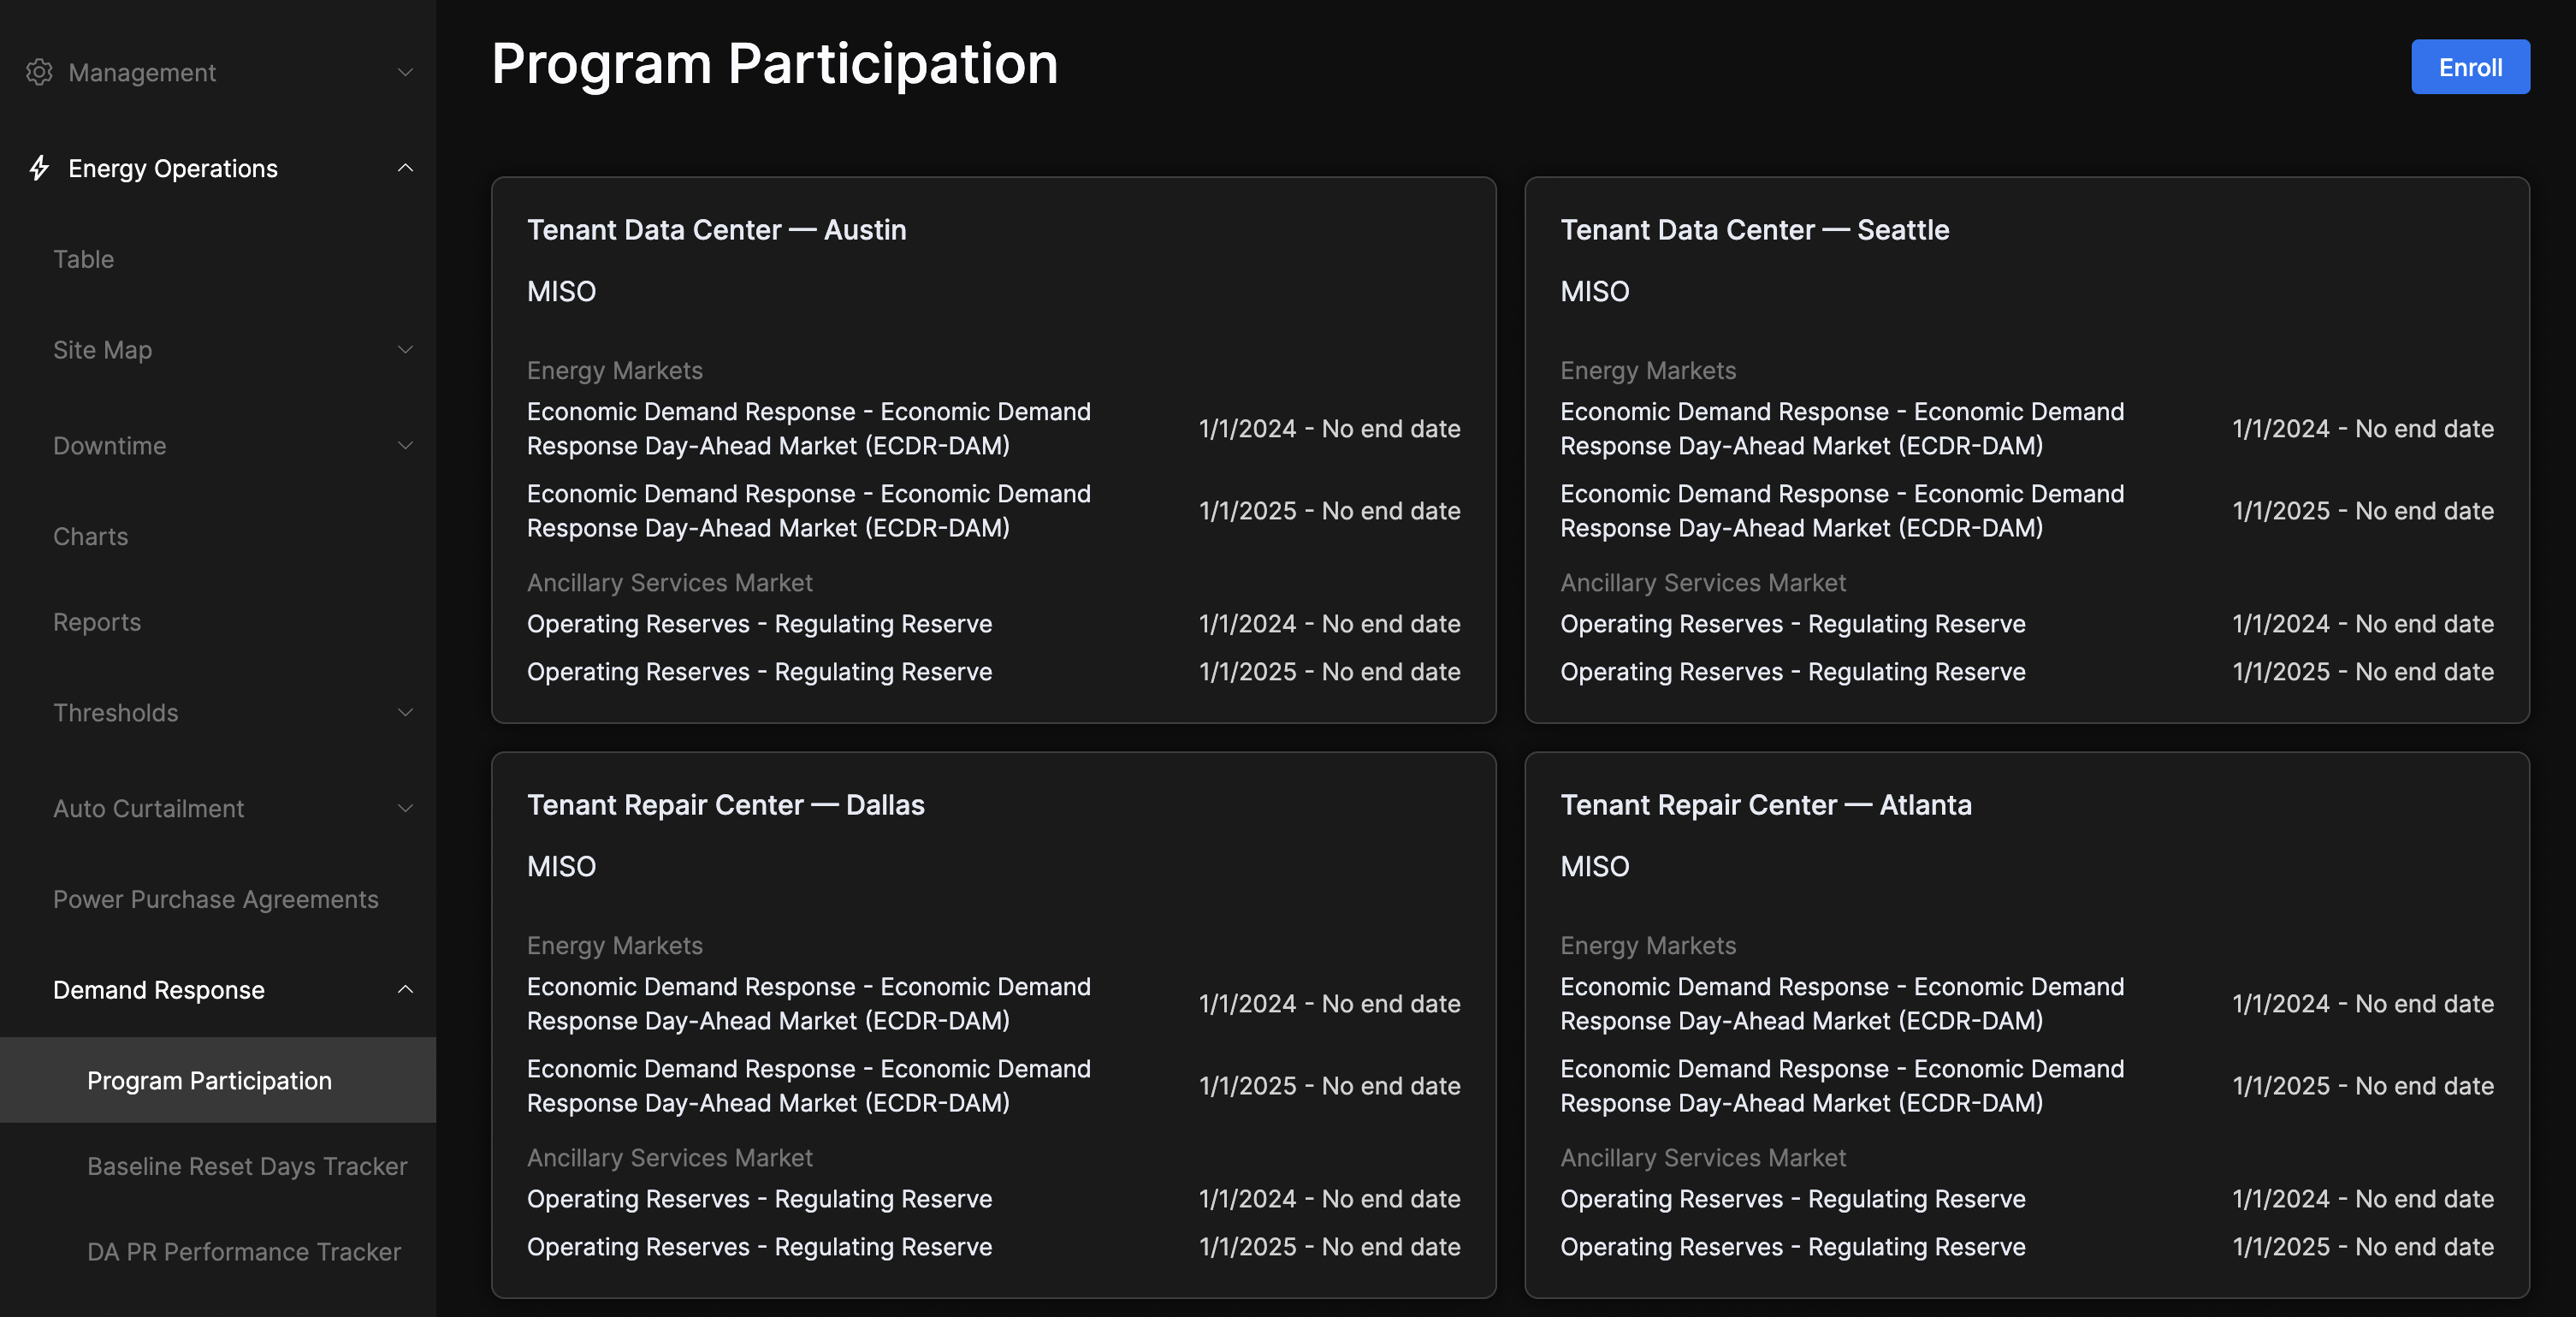
The Program Participation view is where sites are enrolled into ISO energy programs. Enrollments here define which programs each site takes part in and over what period, and they drive every downstream calculation in the Earnings Dashboard and performance trackers.
Each enrolled site is shown as a card listing its ISO and its programs, grouped by program type, with the enrollment timeline for each.
To enroll a site, click Enroll and complete the form: select the Site, then add one or more Programs. For each program you set:
- Site Split — the share of program earnings retained by the facility (split with the program enrollment aggregator).
- Effective Date — when the enrollment begins.
- End Date — when it ends, or toggle No End Date for an open-ended enrollment.
To change a site's enrollments, hover over its card and click the edit icon. The form opens pre-populated with the site's current programs, where you can adjust splits and periods or add and remove programs.
TIP
A site only appears in the Earnings Dashboard and performance trackers once it has an active enrollment for the relevant program. If a program's figures look empty, confirm the site is enrolled for the period you're inspecting.
Program Earnings Dashboard
The MISO Energy Programs Earnings dashboard aggregates what each site earned across its Demand Response programs. Select a site and a year to view a stacked bar chart of monthly earnings, broken down by program (Day-Ahead Price Response and Operating Reserves).
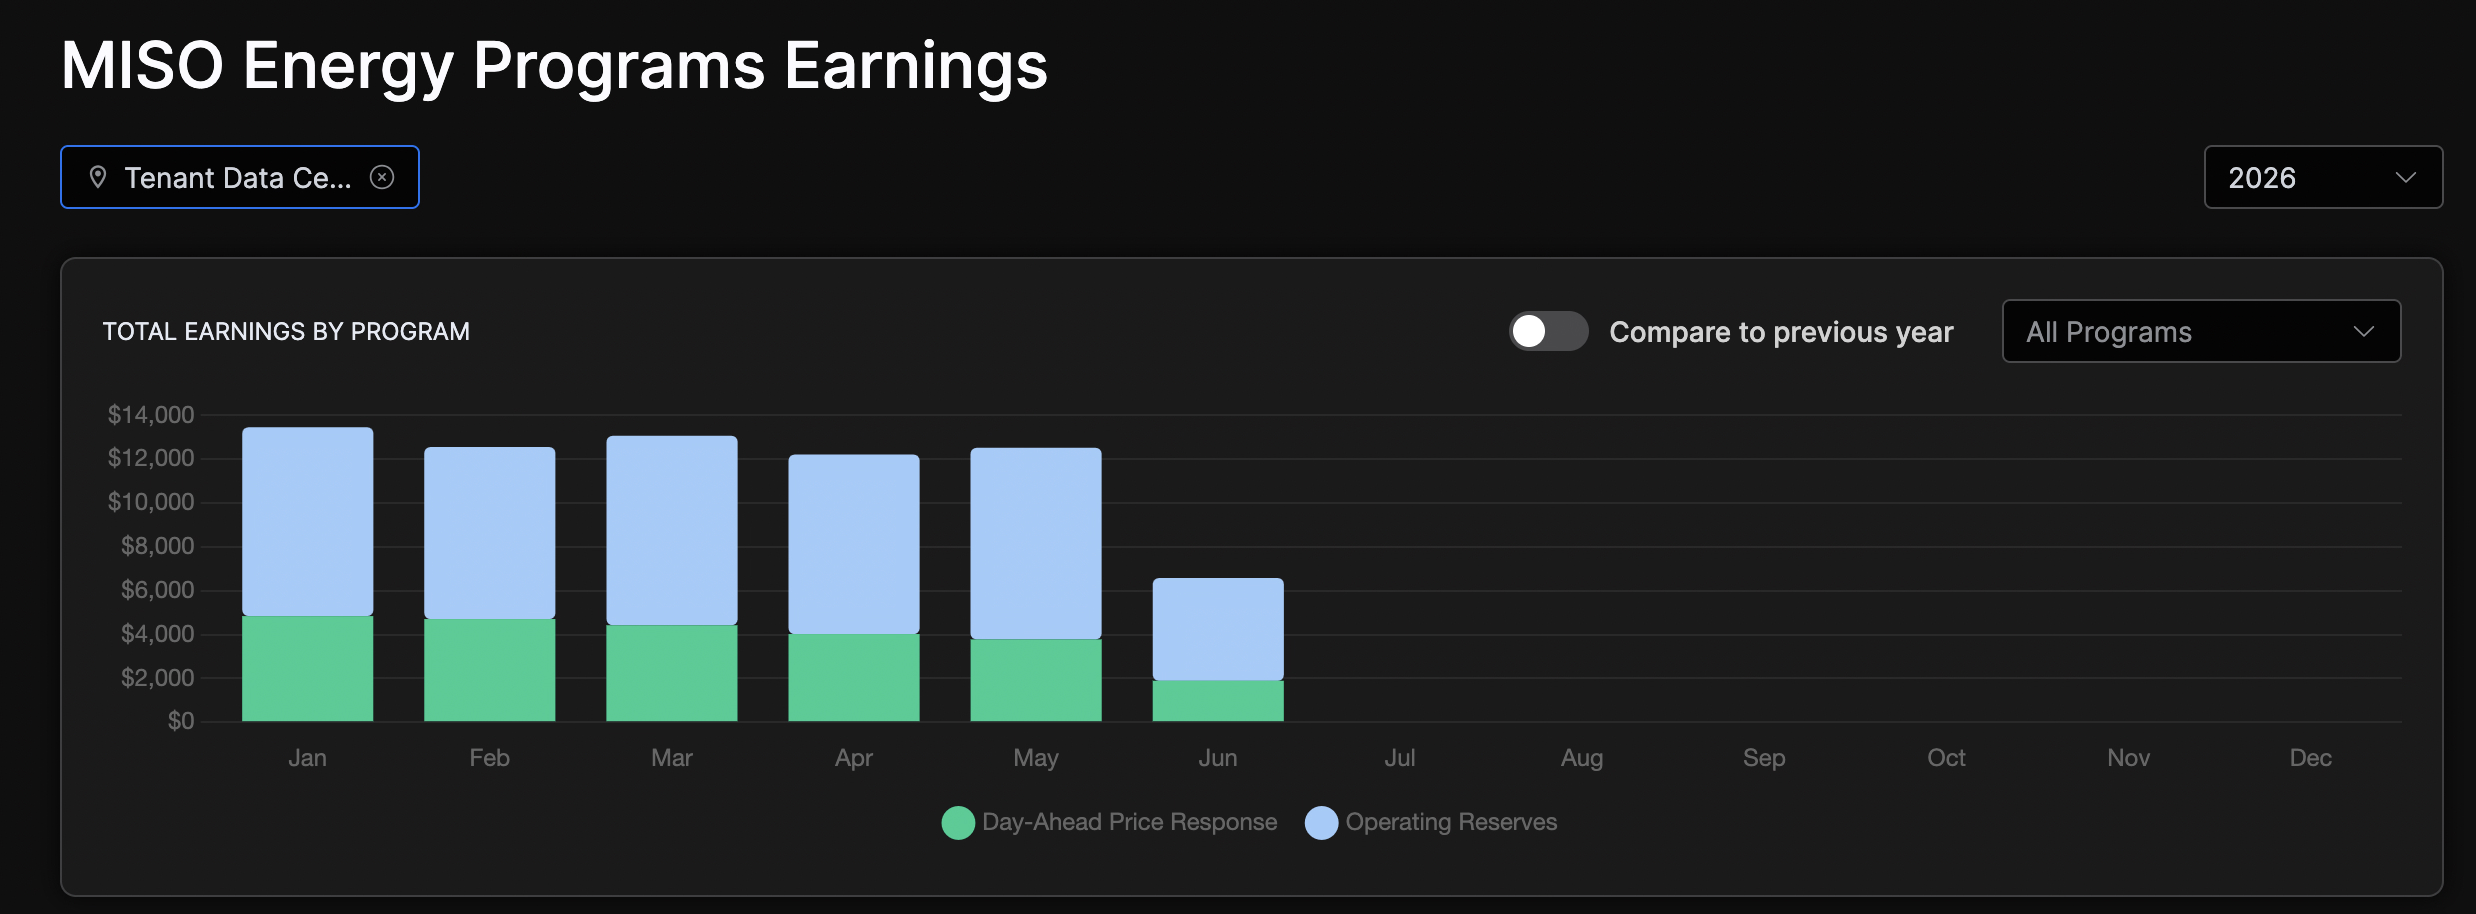
Enable compare to last year to overlay the prior year's monthly earnings alongside the current selection, making seasonality and year-over-year trends easy to read.
Click a month's bar to drill into that month. A pie chart shows how the month's earnings split across programs, and per-program summary cards expand into daily earnings tables for a granular view.
From the summary card you can pick a month and export its program earnings to CSV.
DA PR Performance Tracker
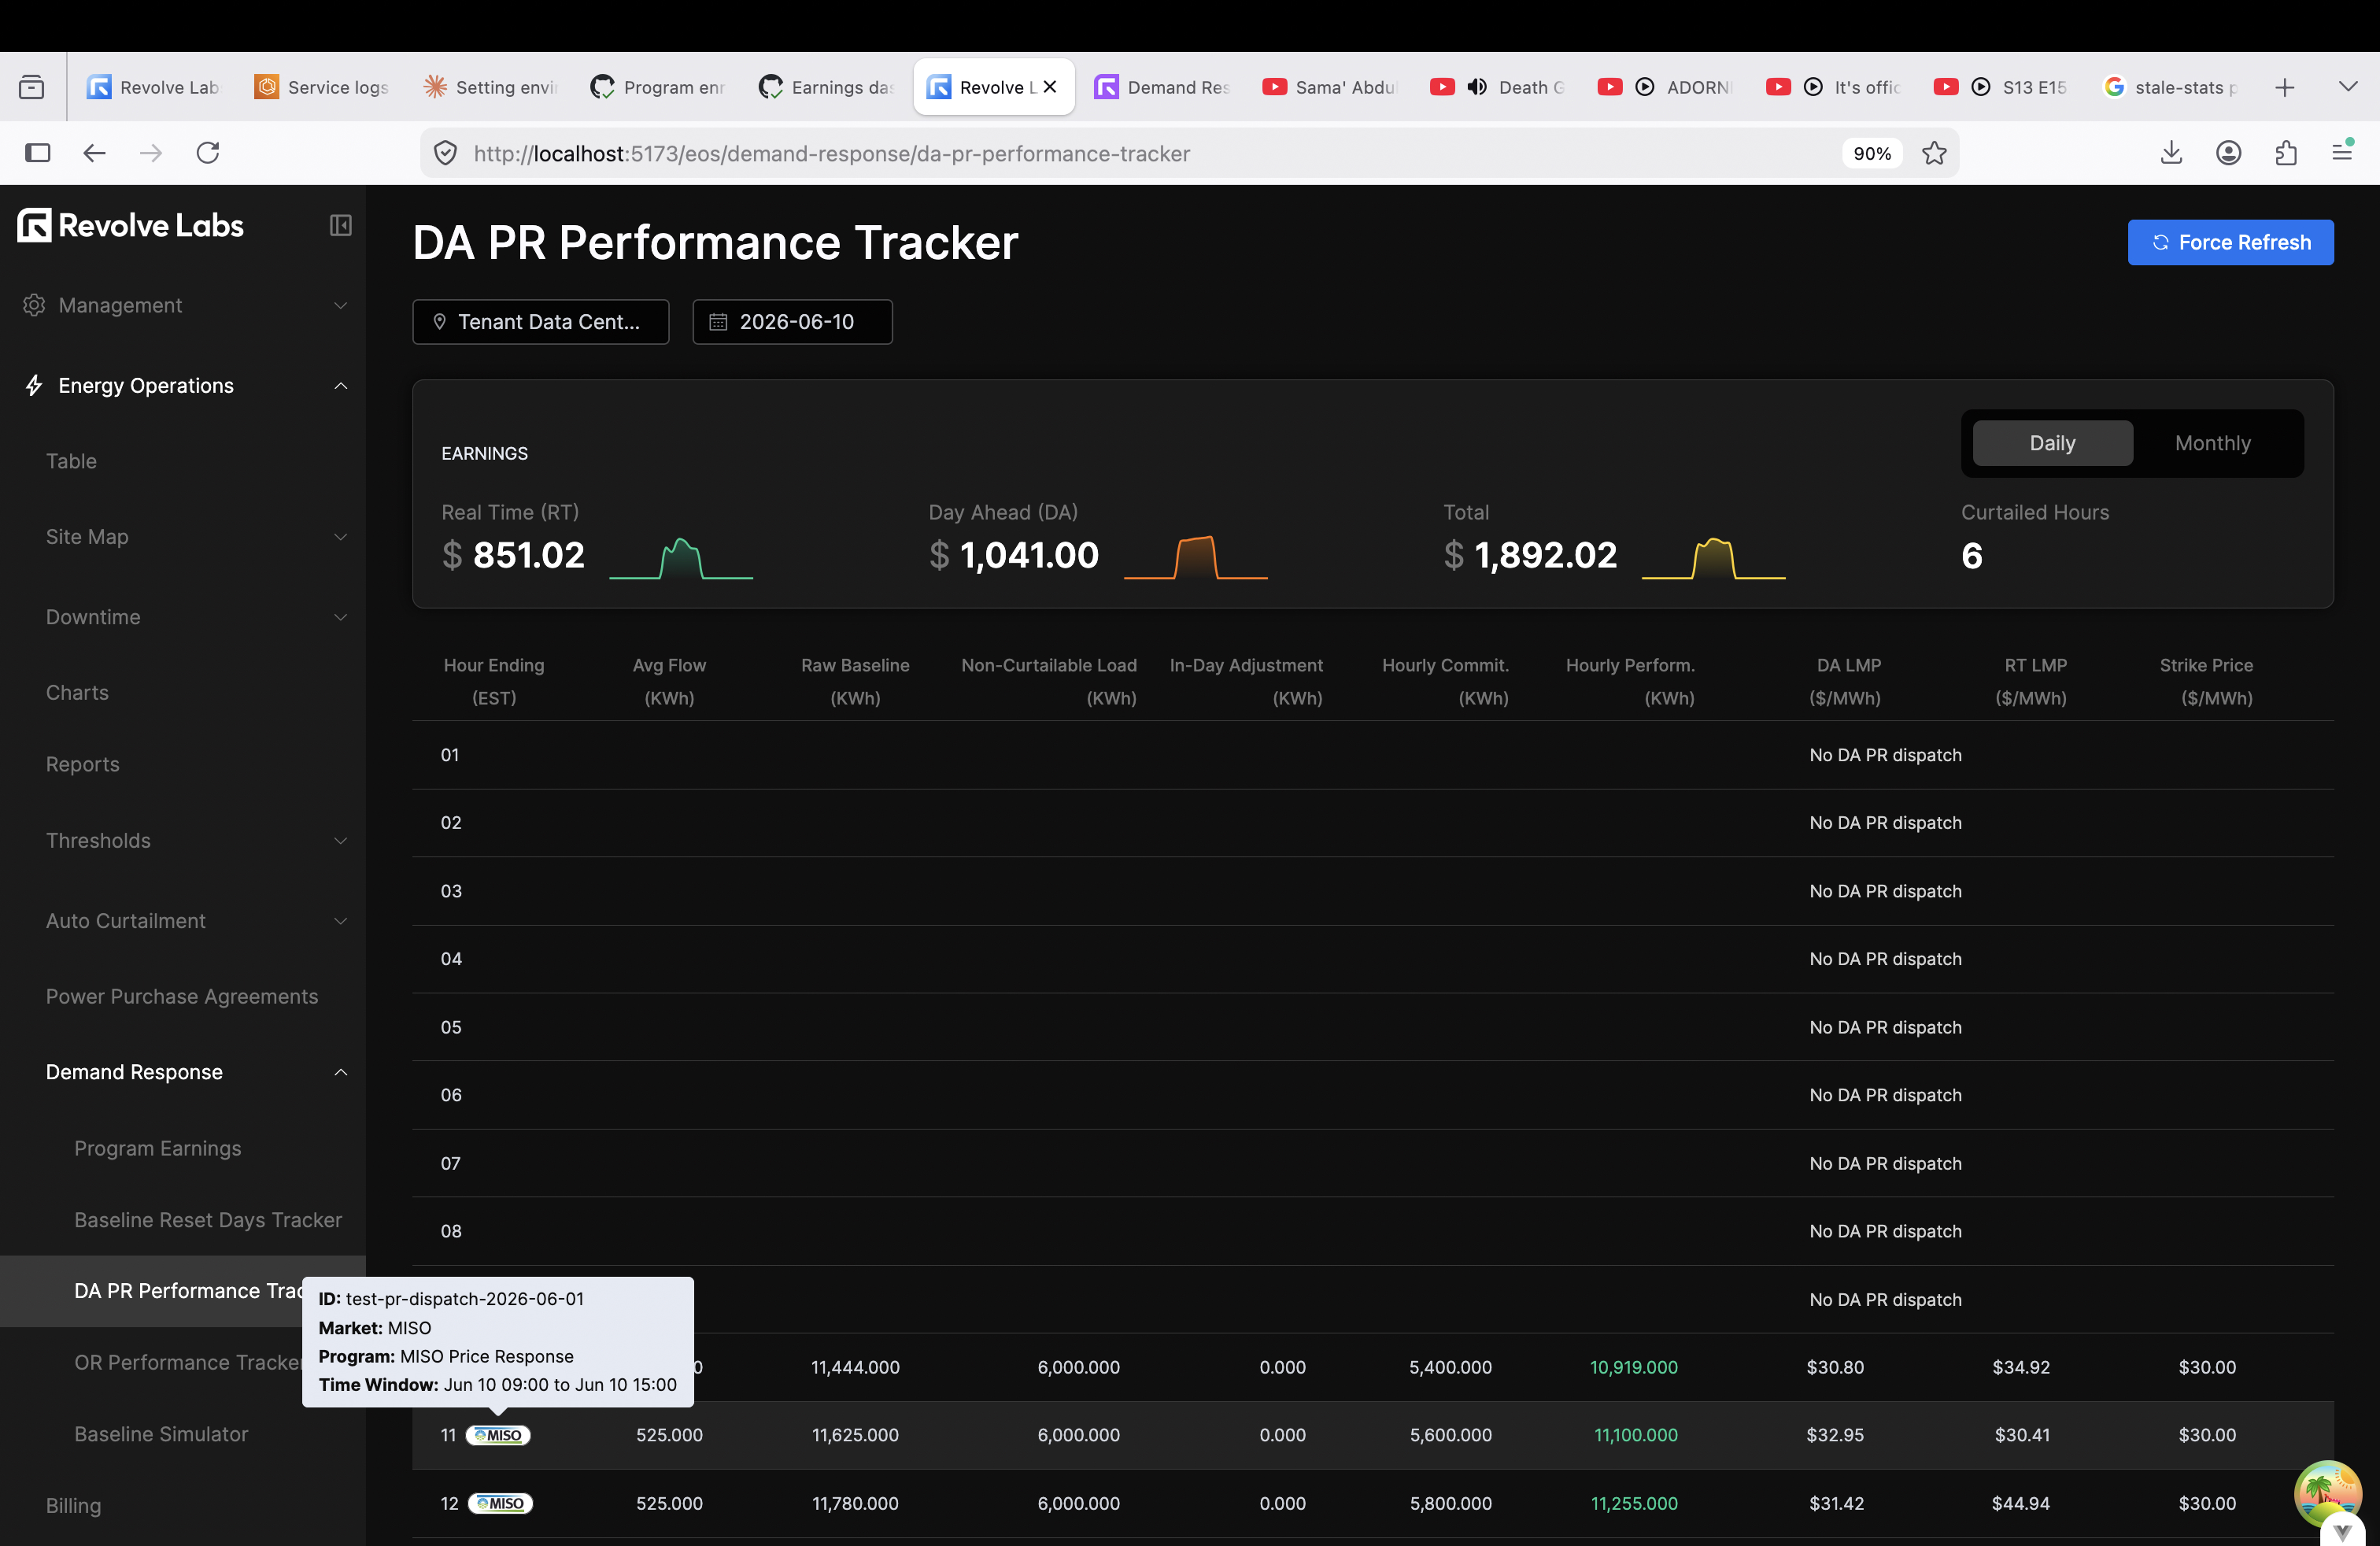
The DA PR Performance Tracker monitors Day-Ahead Price Response performance for a selected site and date (defaulting to yesterday). Headline metrics — Real-Time and Day-Ahead earnings, plus curtailed hours — are shown with sparklines, and a Daily / Monthly toggle switches the summary granularity. An hourly table breaks down RT/DA earnings and the dispatches affecting each hour, with timezone selection and a Force Refresh to bypass the server-side cache for up-to-the-minute data.
Operating Reserves Performance Tracker
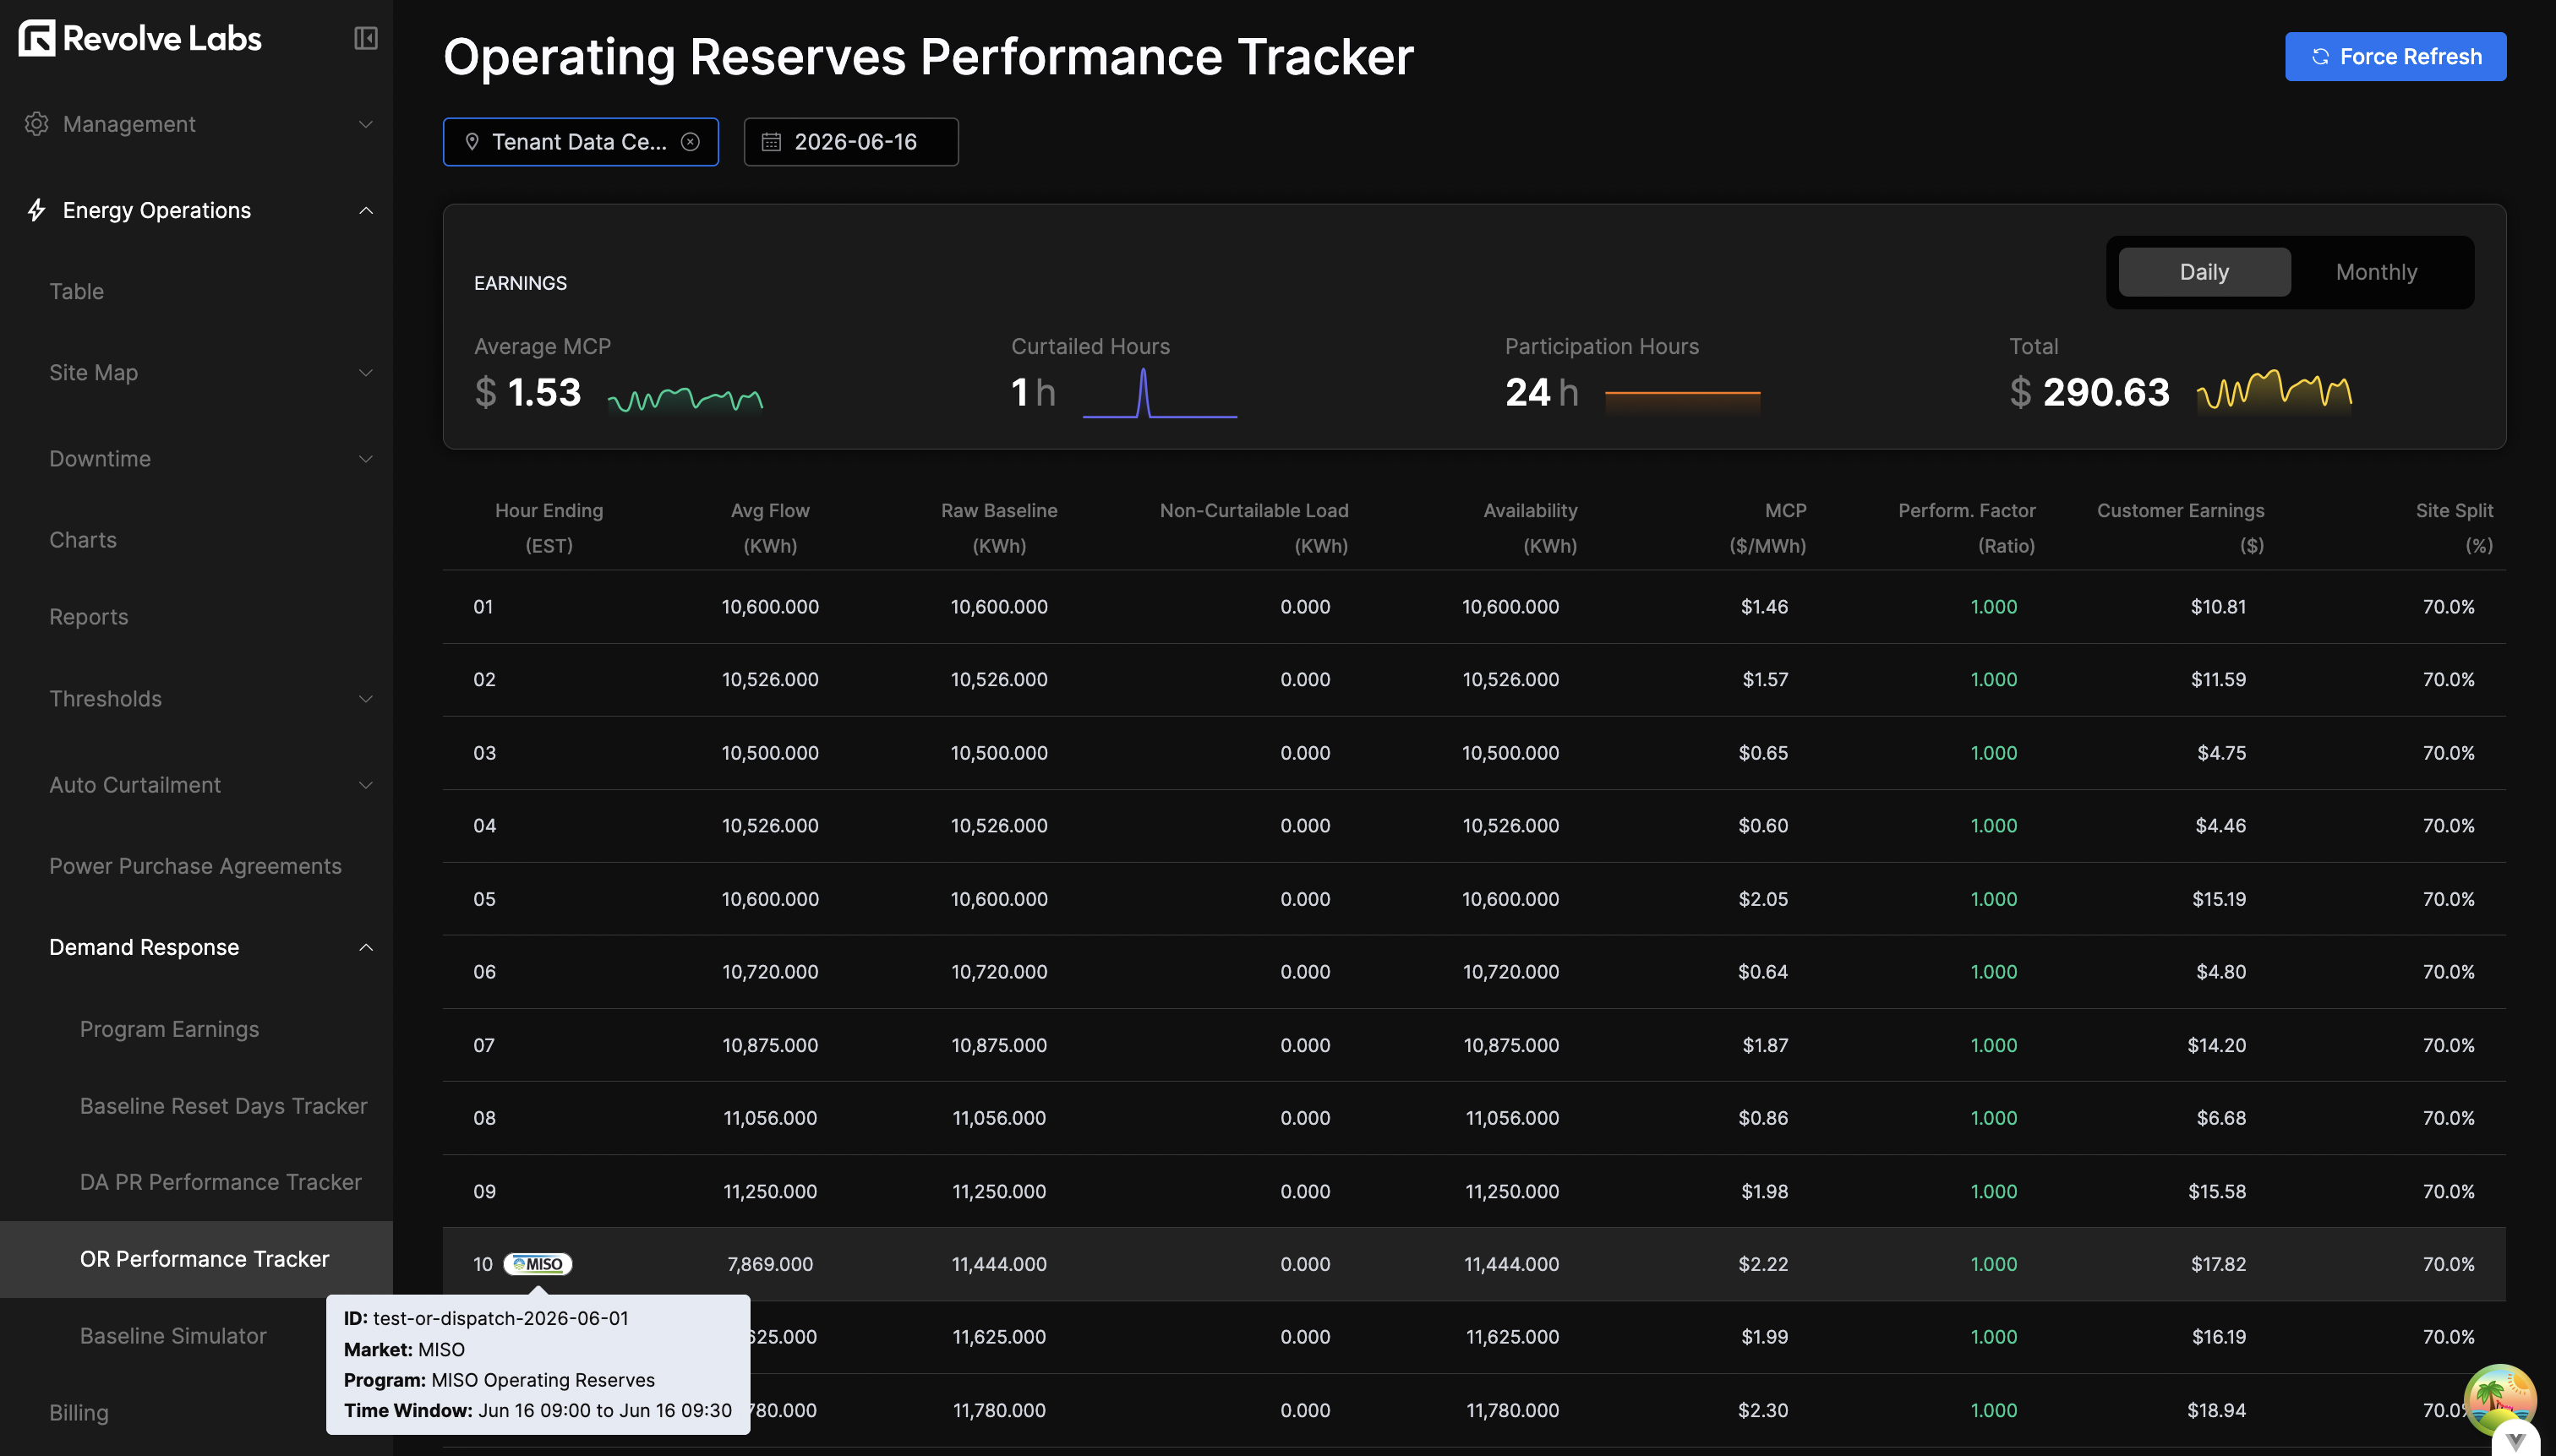
The Operating Reserves Performance Tracker mirrors the DAPR tracker for the OR program. For a selected site and date it surfaces Average Marginal Clearing Price (MCP), curtailed hours, participation hours, and total customer earnings — each with a sparkline — and offers the same Daily/Monthly toggle and Force Refresh. The hourly table reports MCP, participation status, and customer earnings per hour.
Baseline Reset Days Tracker
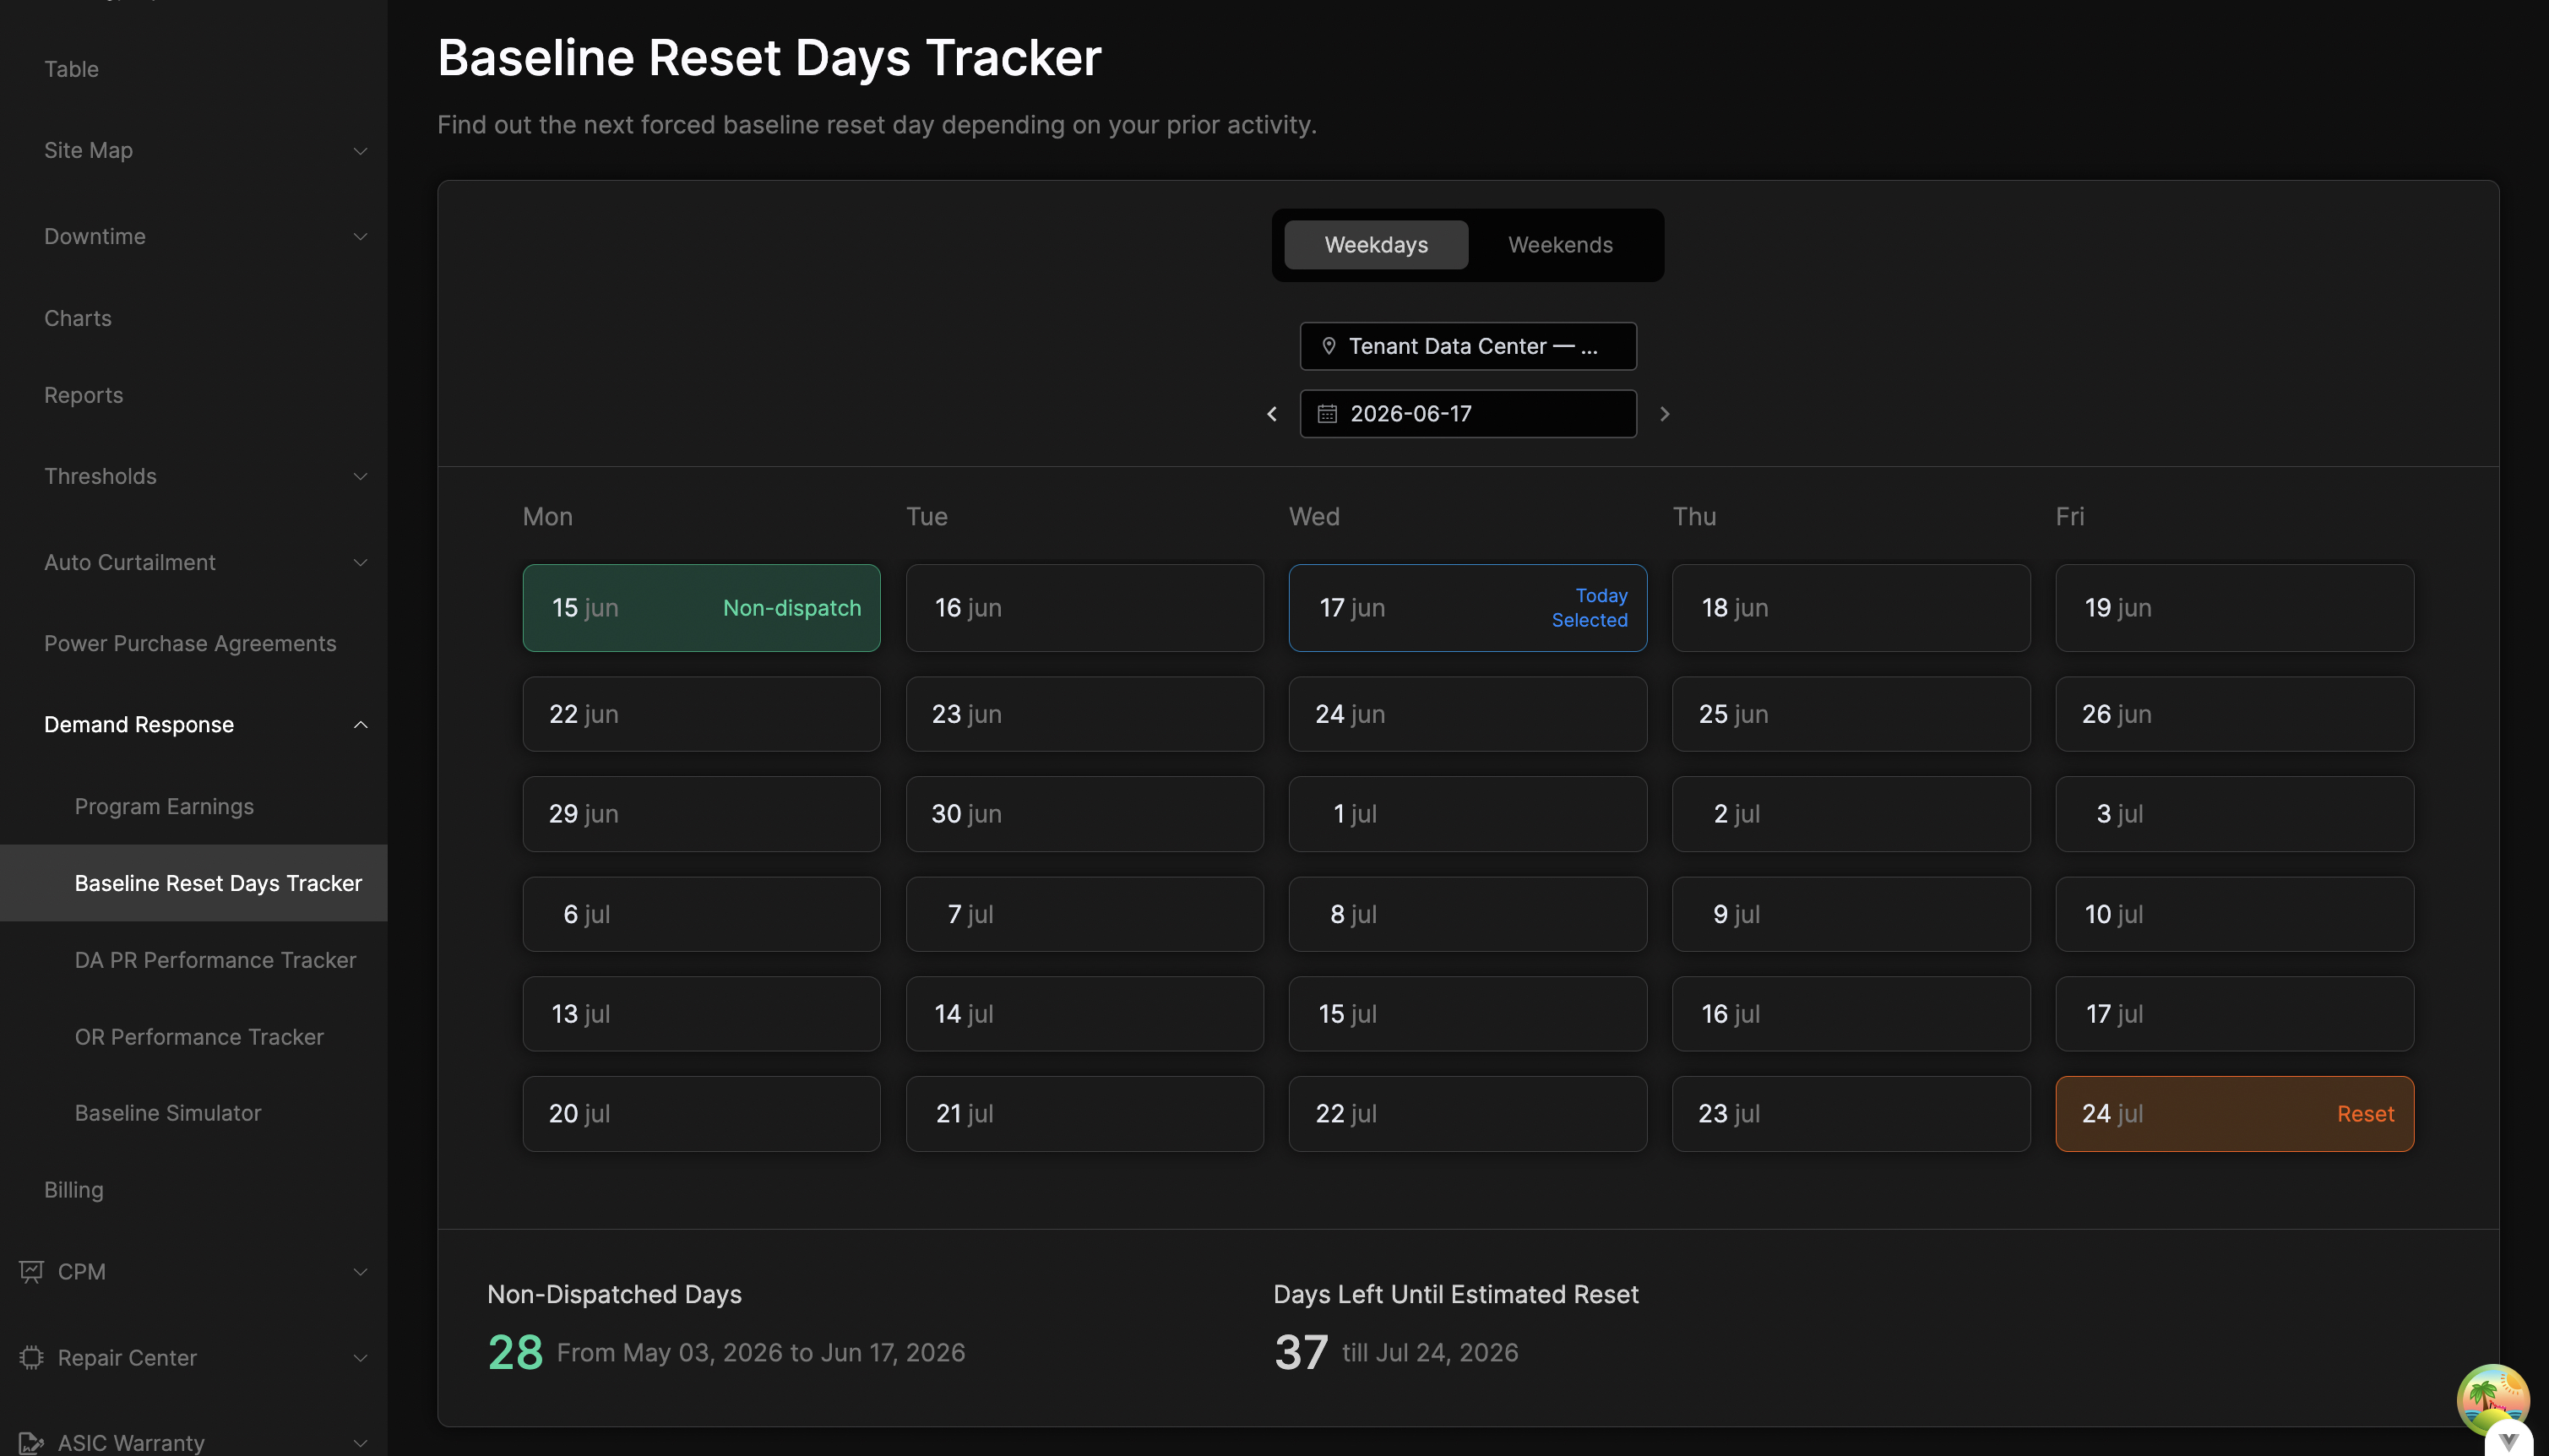
The Baseline Reset Days Tracker helps you anticipate the next forced baseline reset. Select a site and navigate the calendar (split into weekday and weekend tabs) to see, at a glance, which upcoming days are reset candidates and which non-dispatched days count toward the baseline. Footer metrics report the total non-dispatched days in the 45-day lookback window and the days remaining until the estimated next reset.
Baseline Simulator
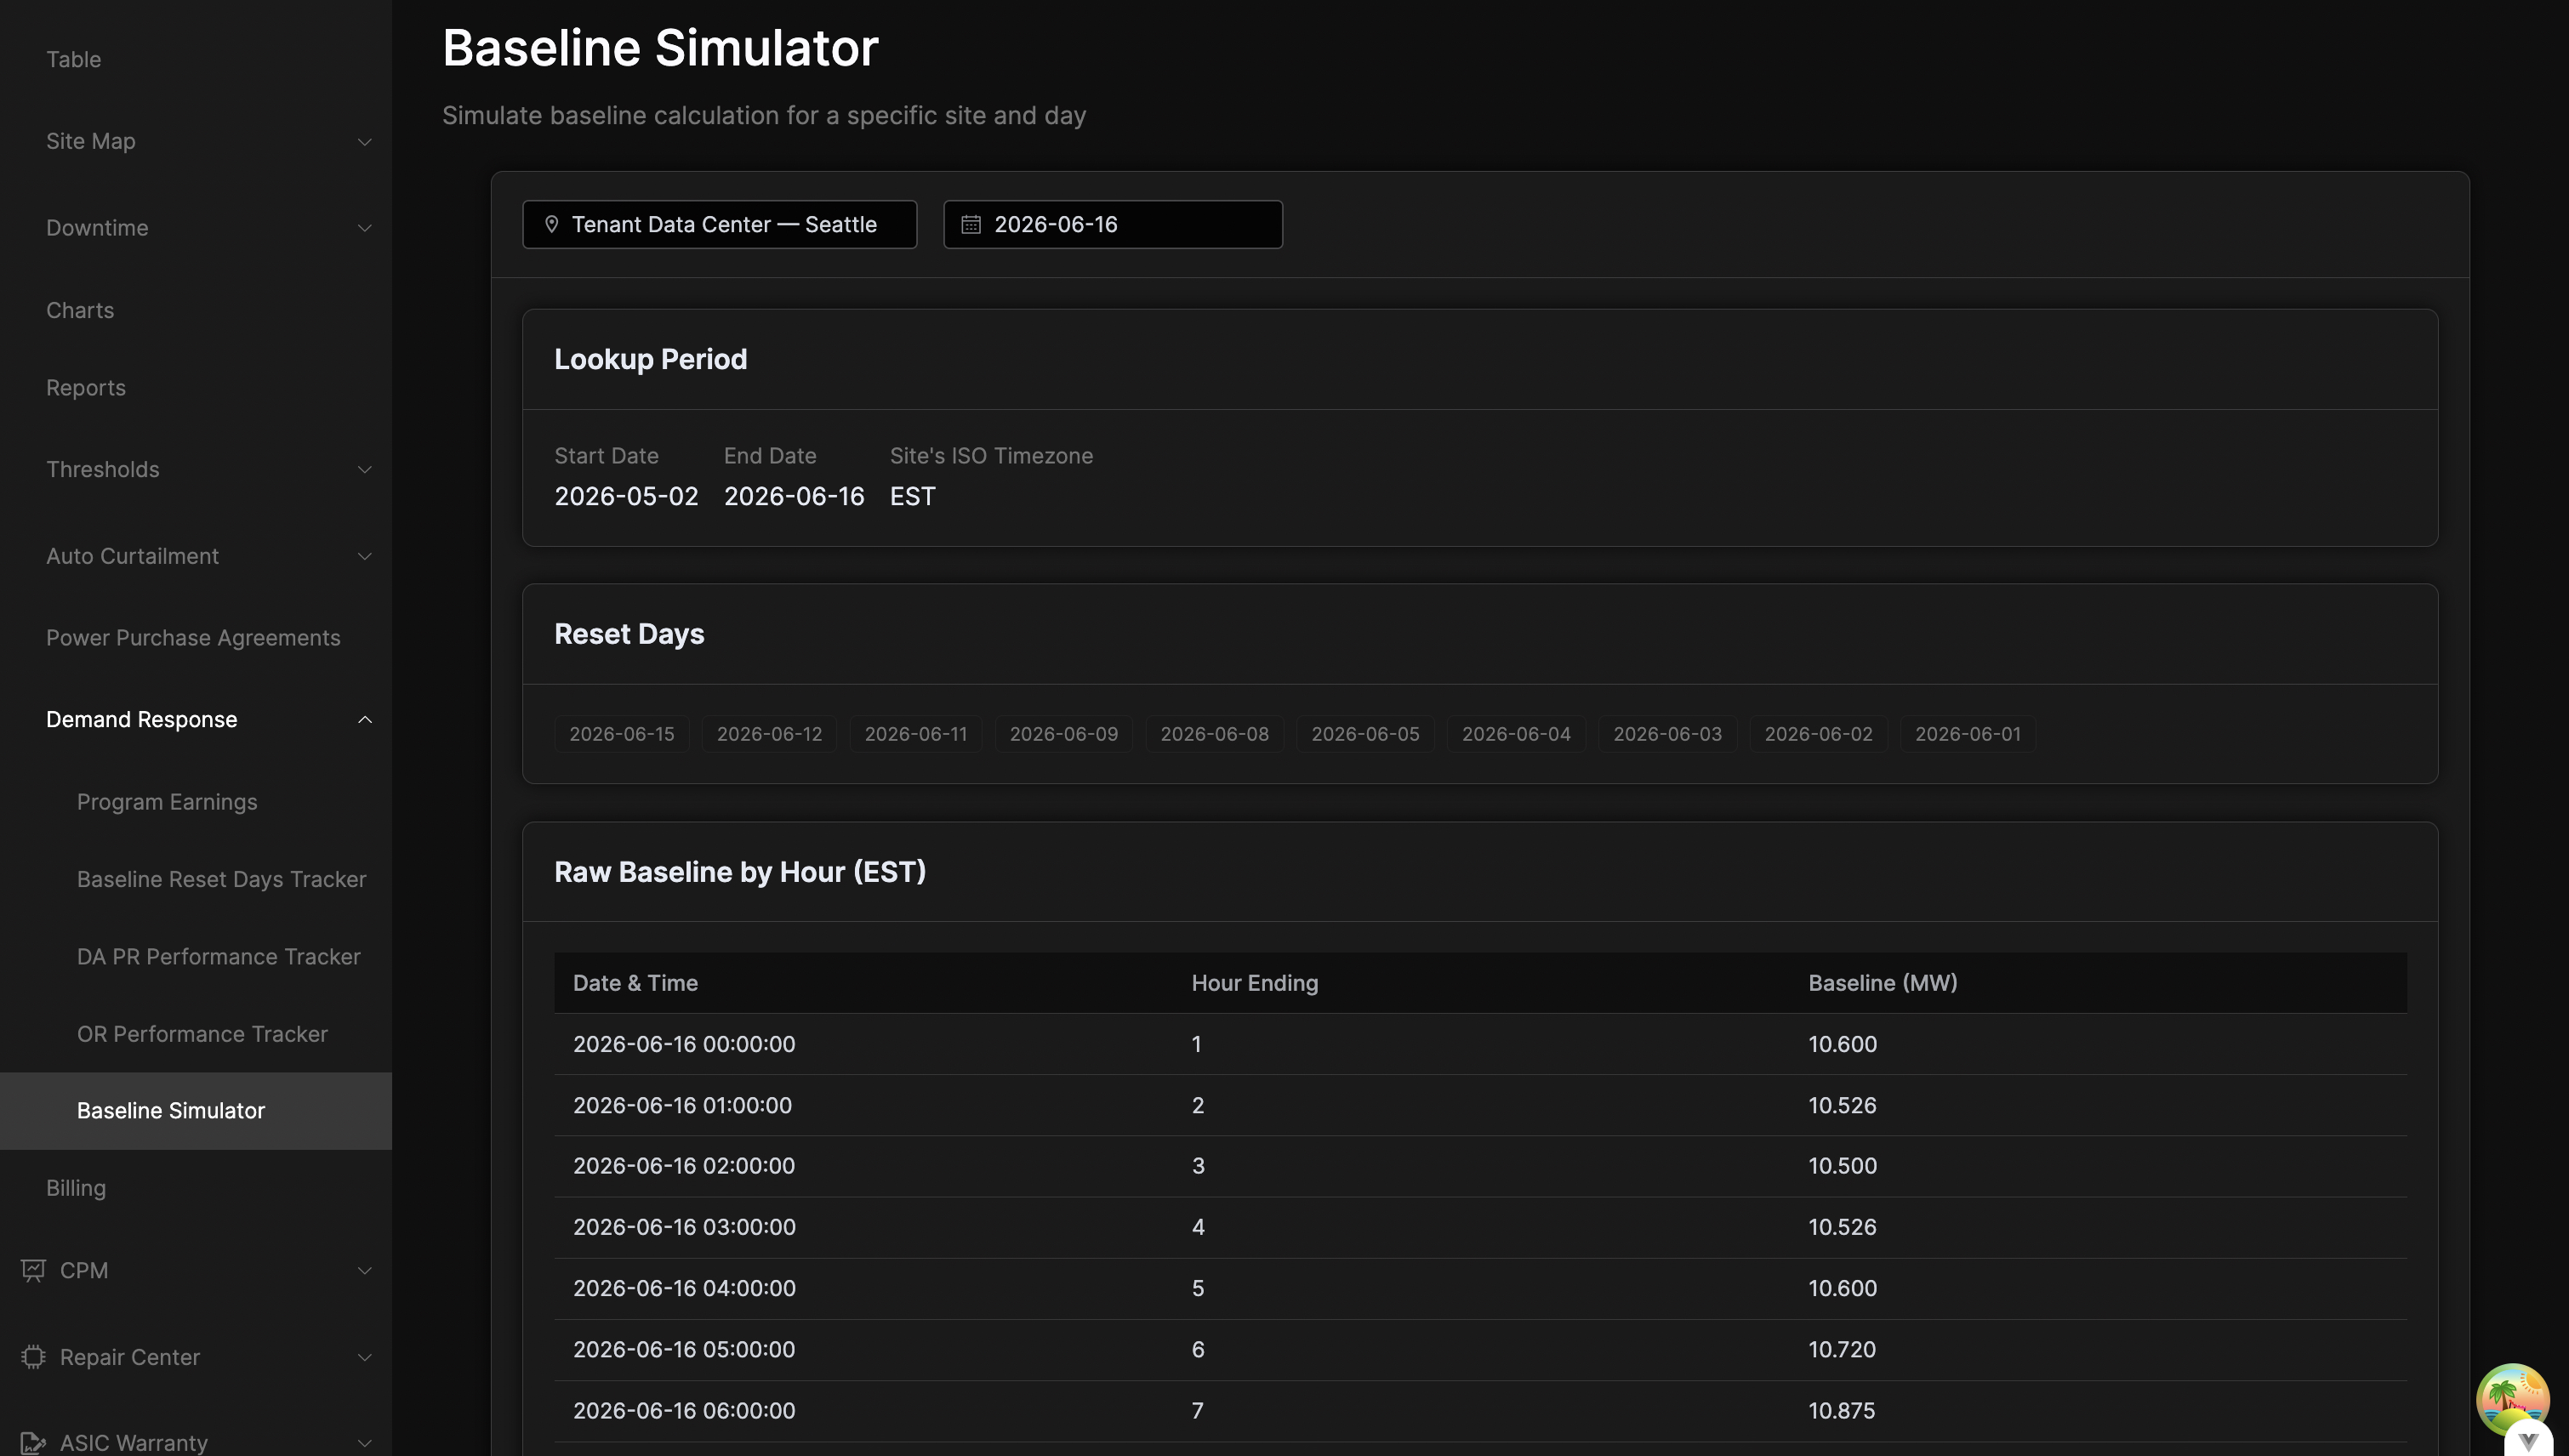
The Baseline Simulator computes a baseline for a specific site and day so you can inspect the inputs behind an earnings figure. It shows the lookup period (start and end dates in the site's ISO timezone), the estimated reset days as tags, and a table of the raw hourly baseline values used in the calculation.